Landslide as a natural hazard is the main problem of many countries since it can be resulted in loss of lives and extensive property damages. Penang Island in Malaysia country is the area which frequently experiences heavy rainfall and subsequently much landslide harm. Thus it has been selected as suitable region to study landslide susceptibility(Lee and Pradhan, 2006). Beside the tropical rainfall as triggering factor, uncontrolled urbanization and deforestation play an effective role to aggravate slope destabilization in this island. So, it is required to forecast and specify the region where future land failure is likely to happen, in order to restrict construction activities on that zone. To facilitate this process, it is necessary to mapping the landslide prone areas(Althuwaynee
Geographic Information System(GIS) has been almost a compulsory tool in landslide hazard and risk assessment(Matori
In this research the AHP and Ordinary Least Square (OLS) approaches have been chosen for making landslide susceptibility mapping. AHP is popular and reliable method in landslide susceptibility mapping, especially when it is integrated with GIS which results in precise values for criteria. The ordinary least squares approach is considered as a basic prediction technique which is commonly used in various application fields. This method can be very quickly applied even to problems with hundreds of features and thousands of data points. However, linear models are not perfect since it is not reasonable to fit a simple line or planes to real world relationships. Although OLS has some weaknesses but it has been chosen for this research as a method to compare with AHP, because some distance factors have been discussed in this study which are suitable for OLS approach.
Finally, it is noticeable that the quality and validity of landslide susceptibility zonation depend on the used methods and also the followed sampling strategies (Yilmaz, 2010). Thus, it is necessary to do comparative studies in order to find the best method for LSZ mapping(Tien Bui
In summery the results of this study suggest that the AHP method is the reliable method that can be used for landslide susceptibility mapping. And also, using more number of landslide contributing parameters increases the validation and reliability of susceptibility map.
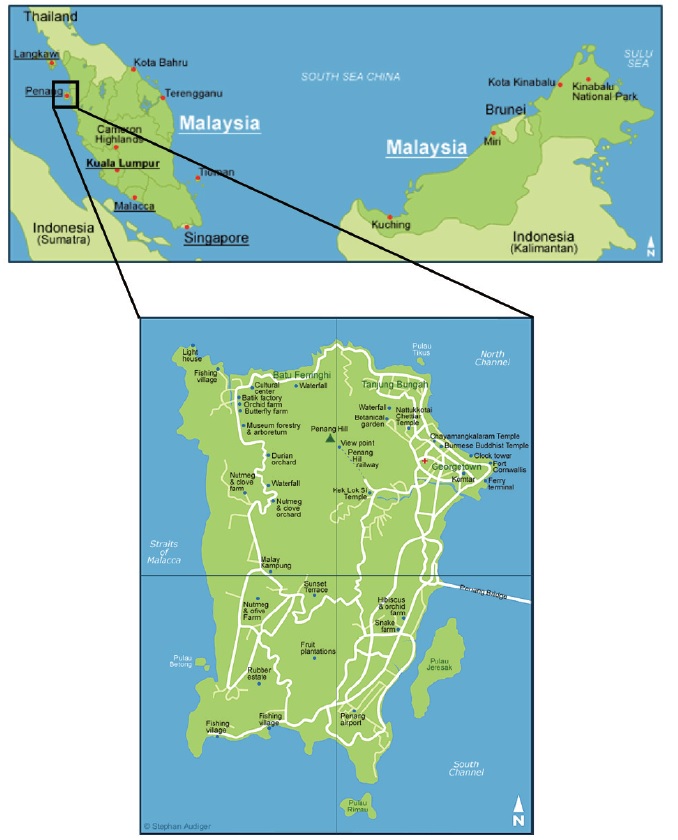
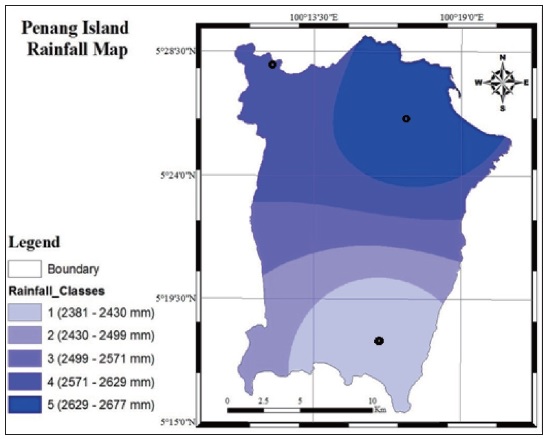
Penang Island is located in the west coast of Peninsular Malaysia(Figure 1). The Penang Island with the area of 293 Sq.km is the fourth-largest in the Malaysia country and the most populated as well. It is located almost between the latitude of 5°15´N to 5°30´N and longitudes 100°10´E to 100°21´E.
The altitude of the Island changes from 0 to 817 meters above sea level and slope degree varies from 0° to 61.598°. The climate is tropical and the mean value of annual rainfall varies from about 2400 to 2700 mm (according to the meteorological records collected from 2006 to 2011). There are three main lithological formations in the study area which are alluvium, granite and micro-granite(Pradhan and Youssef, 2009). The terrain of the Island is mainly represented by coastal plains, hills and mountains with much developed lowland areas.
Since 1970’s, many researchers have applied GISbased techniques to depict the spatial dispensation of landslide-prone areas. In general, all the models generated from all the methods rely on two assumptions: 1) future slope failures in a particular area will occur in the approximately same situation in which previous landslides have happened. 2) Casual factors that exist in GIS database in the form of spatial information can be utilized for evaluating the future landslides(Tangestani, 2009).
The process of landsliding is relied on many causative factors such as geology, geomorphology, and hydrology. Meanwhile, causative factors which considered in landslide susceptibility mapping in Penang Island had been selected based on availability, relevance, and scales. Availability refers to related factors which are readily available, relevance to main factor of land failure happening in a particular area, and scale to existing maps of factors that can be used in making a slope stability map. Therefore, in this study seven causative factors have been verified in order to mapping the susceptible zones to land failure in Penang Island; Slope degree, distance to rivers, distance to roads, distance to faults, lithology, land use/land cover, and precipitation.
1. landslide causative factors
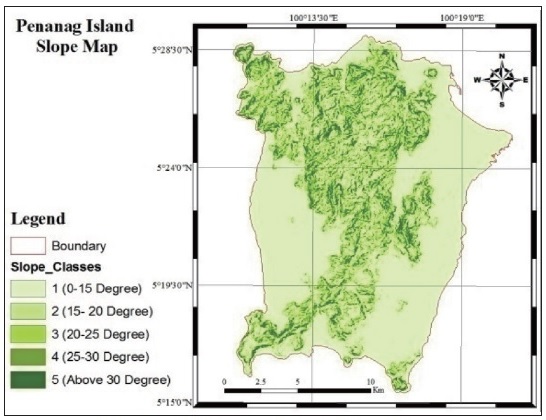
1) Slope
Since, the slope degree is straightly related to landslide, it is frequently applied in providing landslide susceptibility maps(Dia
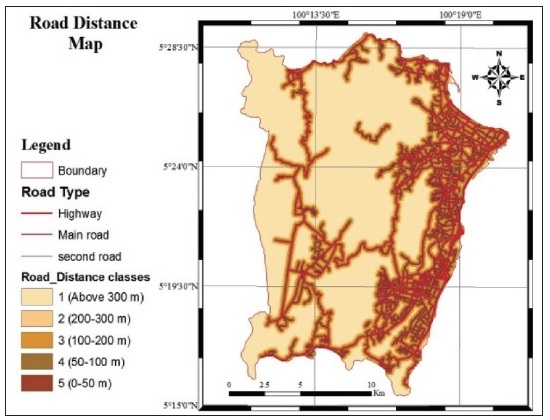
2) Distance to Road
Distance to roads is another parameter that has been considered in many researches because landslide may fall out on the road and on the slopes sides resulted from road constructing activities(Pachari
Road lines have been digitized from the hard copy of road network map that had been provided from Department of Survey and Mapping Malaysia(JUPEM), in the scale of 1:50,000. Then Straight Line or Euclidean Distance approach was applied to make different classes over the study area. The closest regions to the roads were classified to 5 zones based on the distance(Figure 3).
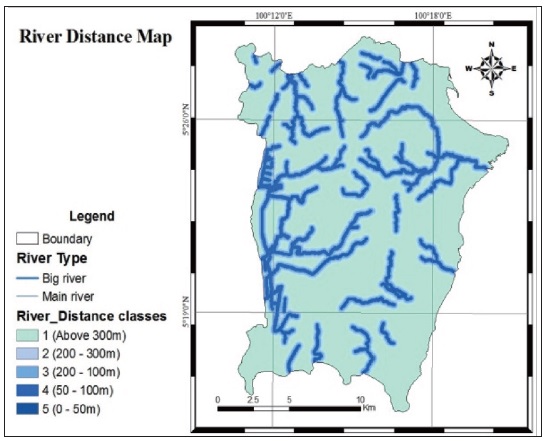
3) Distance to Rivers
Hydrological condition of the area or the saturation degree of the soil on slopes has been defined as a stability contributing parameter in landslide initiation in Penang Island. Water infiltration in soil, runoff, and groundwater flows were all happened under the hydrological circumstance(Thanh and De Smedt, 2011). Closeness of the slopes to river lines may affect its stability, because the proximity to rivers would activate the erosion process along the slope(Mancini
The rivers map required for this part of the project had been provided from Department of Survey and Mapping Malaysia(JUPEM), in the scale of 1:50,000 (Figure 4).
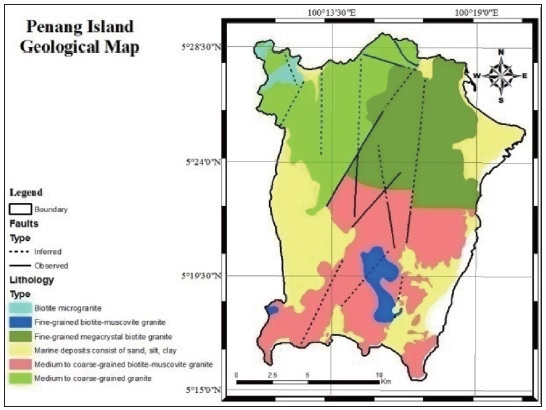
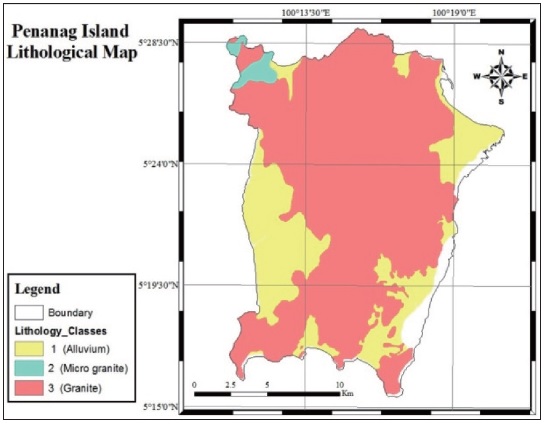
4) Lithology
Different lithological specifications of an area lead to different strength and penetrance of rocks. Each particular lithological unit has its specific susceptibility value. For this reason, the soft copy of geological map in .pdf format and with the scale of 1:63,300 had been collected from Mineral and Geoscience Department of Malaysia(Figure 5). Then, it has been converted to IMAGINE Image format for further analysis in ArcGIS software. The lithology map of the study area was prepared including six lithological units; 1) Biotite micro granite, 2) Medium to coarse-grained granite, 3) Finegrained mega crystal biotite granite, 4) Fine-grained biotite-muscovite granite, 5) Medium to coarse-grained biotite-muscovite granite, and 6) Alluvium(marine deposits consist of sand, silt, and clay). Since the first 5 units generally known as granite type, the area was classified to two unit according to their grain size; Micro granite and Granite. So, the six units were compressed to following three lithological units; Alluvium, Micro granite, and Granite. In igneous rock areas(Granite areas), the probability of landslide occurrence is higher versus Alluvium. So, the sequence of the classes related to landslide susceptibility, was generated as bellow; 1) Alluvium, 2) Micro granite, 3) Granite. The region corresponding to class number 3 was found the high prone area to land failure(Figure 6).
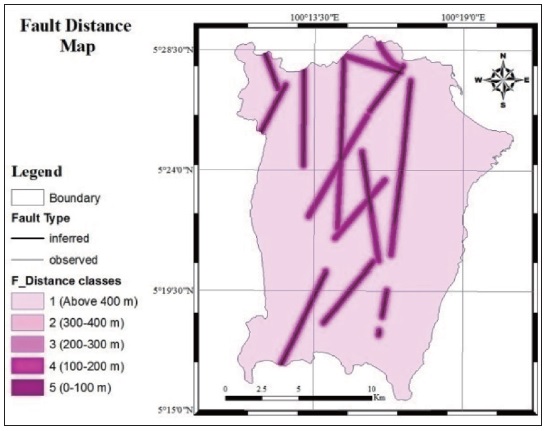
5) Distance to Faults
The fractured rocks exist in faults form week zones or lines that present favorable conditions for landslides. It is accepted that the risk of land failure decreases in the further distance from tectonic structures. Landslides promotes in study area due to flow of water along fault planes and the erosion occurrence consequently. At first, the soft copy of geological map including fault lines in .pdf format(scale 1:63,300) and had been prepared from Mineral and Geoscience Department of Malaysia (Figure 7). Then, it has been converted to IMAGINE Image format in order to be used in ArcGIS software. In this study the distance from faults was calculated at 100 meter interval. The classified fault distance map has been extracted through Euclidean Distance method.
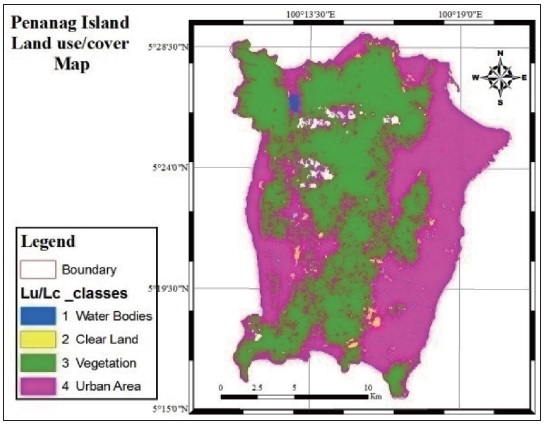
6) Land use/ Land cover
In this study the image of Penang Island downloaded from USGS website has been clipped by the boundary shapefile. Actually, the image firstly prepared in ENVI 4.7 software and then classified to four classes; water bodies, clear land, vegetation, and urban area. The Maximum Likelihood classification method has been used for this image preparation. Then classified image converted to shapefile and finally exported to ArcGIS software(Figure 8).
7) Precipitation
Precipitation is initiation factor in landslide occurrence due to its major influence on runoff and pore water pressure. Total rainfall, short-term intensity, antecedent precipitation, and storm duration are the main rainfall measurements considered as effective factor in landslide initiation. Choosing from these factors for subsequent analyzing usually depends on rainfall records availability. In this study the average monthly rainfall data from three existing weather stations, was collected for the past ten years (2003 to 2012).
The stations located in northwest, northeast, and southeast of Island have recorded the annual average rainfall of 2608 mm, 2677 mm, and 2381 mm respectively. Then, an annual precipitation map of Penang Island was produced by Inverse Distance weighting(IDW) method over the three stations. This method is one of the spatial interpolation methods that are available in ArcGIS software spatial analyst tools.
AHP is widely applied in regional planning, resource allocation, routing modeling, suitability analysis, site selection, and landslide susceptibility analysis(Ayalew
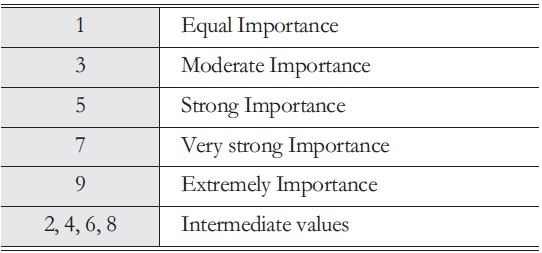
Rating scale
In this study the landslide causative parameters were put in sequence of importance. The relative importance of each parameter has been evaluated according to scientist researches especially for Penang Island(Lee and Pradhan, 2006; Pradhan
[Table 2.] Aggregate pair-wise comparison
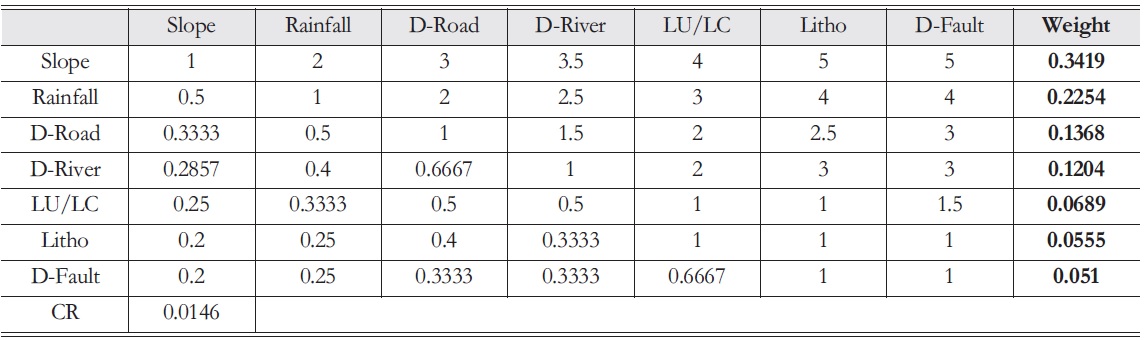
Aggregate pair-wise comparison
Sensitivity analysis through simulation models helps researchers to specify the credibility of the result in cases where multi-criteria weights have been investigated(Chen
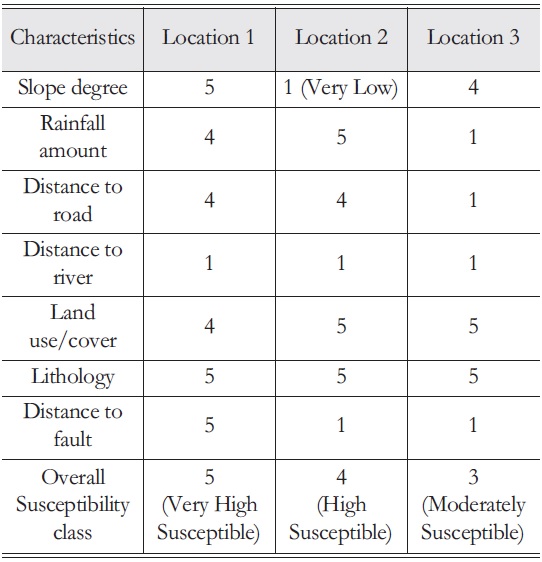
[Table 3.] Susceptibility of locations (Alternatives)

Susceptibility of locations (Alternatives)
4. Ordinary Least Square Technique
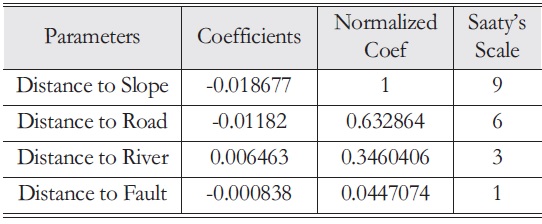
Ordinary least square method is used in order to investigate the relation of current landslides and defined criteria, such as high slope regions, areas with high road density, area with high river density and so on. In fact the main aim of this method is to investigate the current situation. By using this method the effect of various criteria on existing landslides were found, and the coefficients for each landslide occurrence parameter is shown in a table generated by OLS function(Table 4). These coefficients calculated by OLS, are based on the average distance between each happened landslides to parameters. For this reason, the point layers were created for landslide contributing factors. So, the land use/ land cover, lithology, and rainfall were eliminated, because point layers resulted from these factors were not reliable. Thus, the four independent factors used in OLS approach were slope, distance to road, distance to river, and distance to fault. The inventory map which had been produced by scientists through interpretation of aerial photographs, reports and field surveys, has been used for digitizing the location points of land failures occurred in Penang Island. Then the OLS measurements between existing landslides to road network density and rivers, high slope regions, and regions on faults were produced. Calculated coefficients of each parameter has been normalized and converted to Satty scale in order to apply in ArcGIS software(Table 4).
[Table 4.] Ordinary Least Square calculation

Ordinary Least Square calculation
Validation of landslide susceptibility maps was an absolutely essential component in this study. Without a validation, the maps are useless and have no value. For this reason, landslide inventory map which shows the previous landslide locations, were used to validate the landslide susceptibility maps. In order to verify the output maps, they were first converted to vector format then overlaid with the landslide inventory map by means of GIS software. From attribute table, the number of previous landslides that fell into each class of susceptibility was calculated easily. This procedure was done for three susceptibility maps generated in this research.
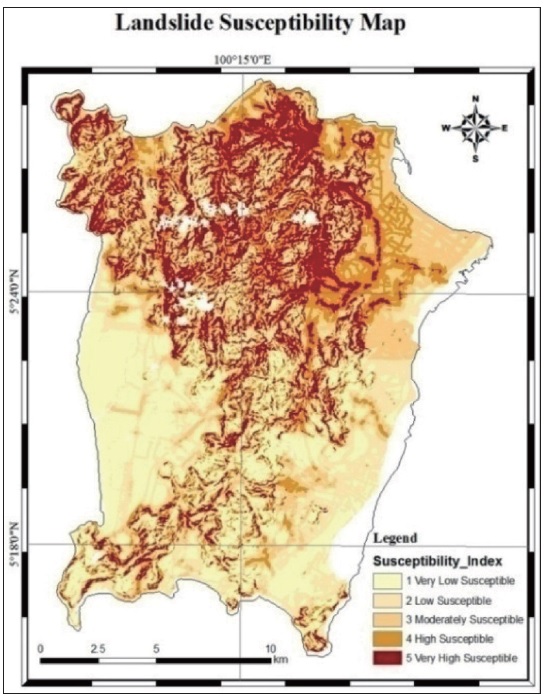
In first part of the research, AHP method was applied using seven factors. Figure 10 shows the output map.
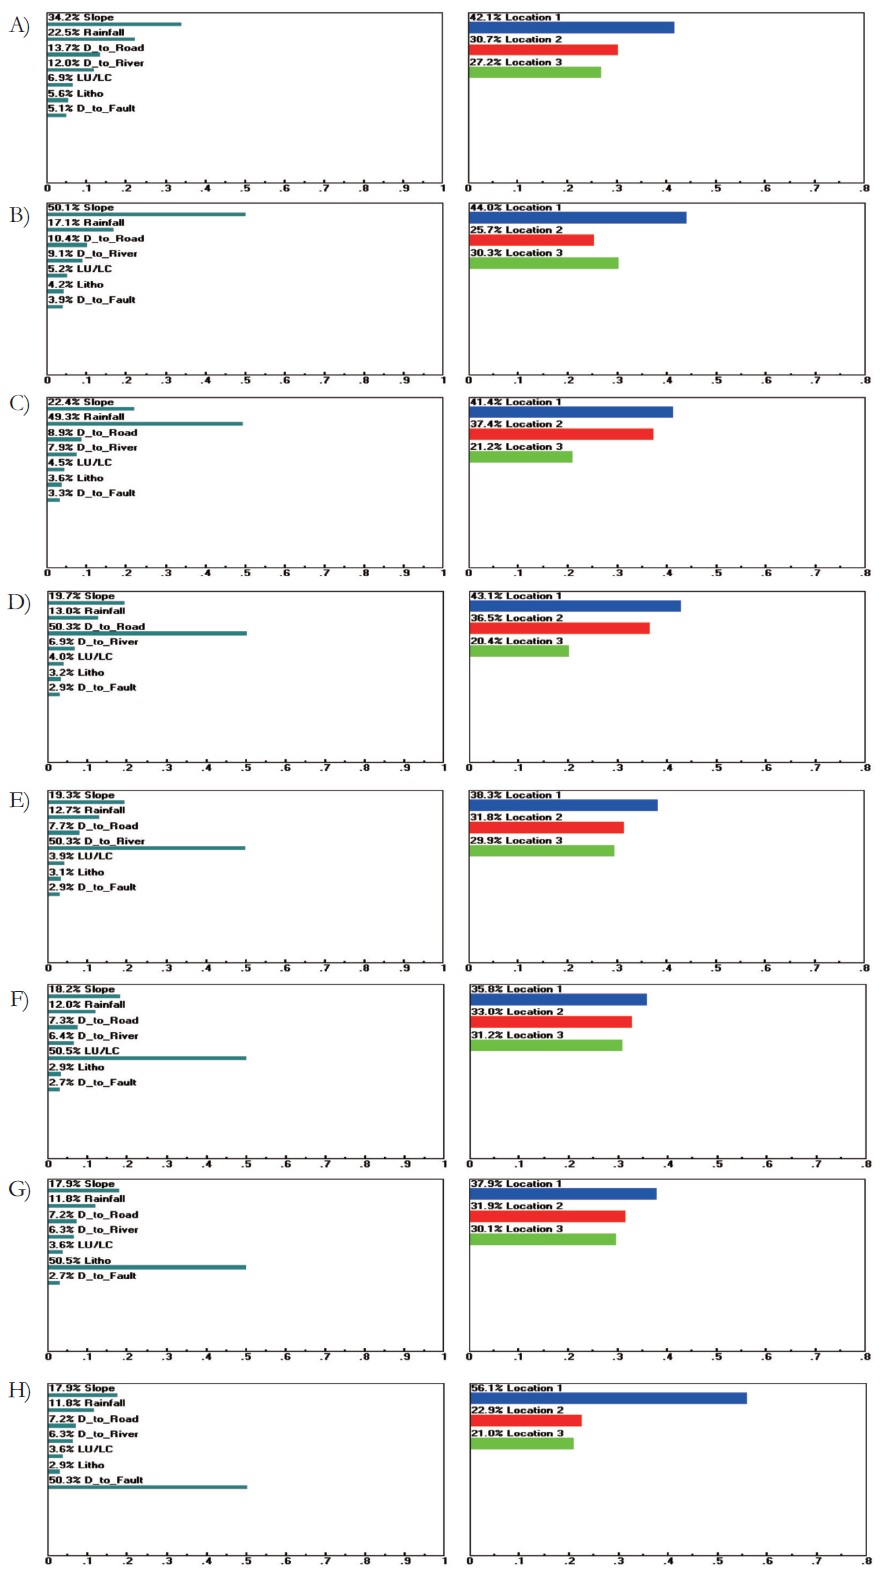
Sensitivity analysis was performed by Expert choice software. Figure 11-A illustrates the numerical original condition of parameters and alternatives in Dynamic graph of Expert Choice software. Point 1 is 42.1% susceptible, point 2 is 30.7% and point 3 is 27.2% susceptible, with slope, rainfall, distance to road, distance to river, land use/cover, lithology, and distance to fault criteria priorities of 34.2%, 22.5%, 13.7%, 12%, 6.9%, 5.6%, and 5.1% respectively. As shown in figure 11-B, -C, -D, -E, -F, -G, and -H, the priority of each criterion is increased up to 50%; while susceptibility and priority of alternatives(locations) does not change significantly.
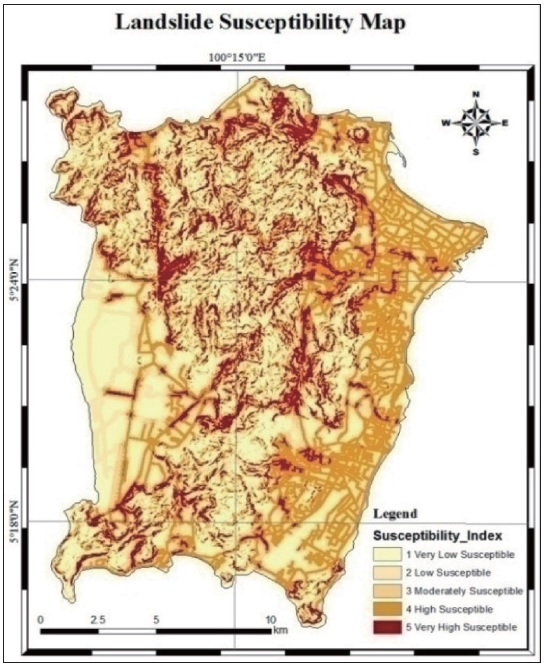
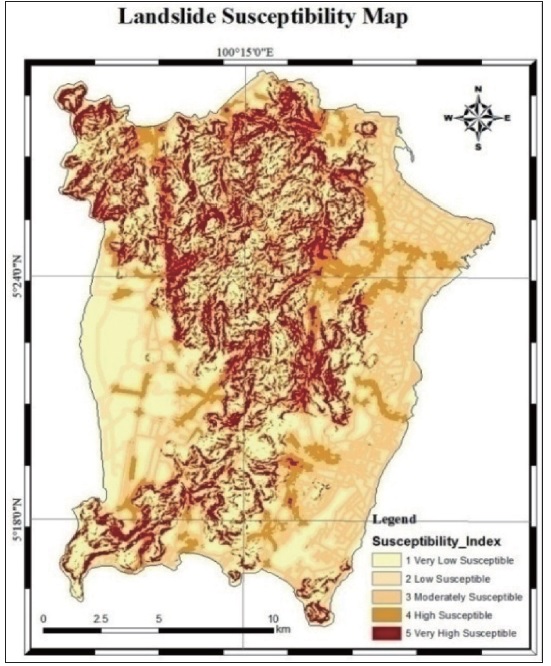
In another part of the research, the weights calculated by OLS approach for four factors were used to make landslide susceptibility map. The map executed by OLS technique is shown in figure 12. In order to do practical comparison between AHP and OLS, a landslide susceptibility map has been made by AHP with the same factors used in OLS approach(Figure 13).
According to the validation result summarized in table 5, many landslides that have occurred in the past fall into the very high and high susceptibility class. The outcome was that the 75% of occurred land failures fit into the very high and high susceptibility class of AHP map(using seven parameters), while this is 73.8% in the case of AHP with point parameters, and 65.8% for the OLS map. The weakness of OLS technique is that, only point parameters can be evaluated. The reason is that the evaluation of criteria by this technique is based on average distance of point parameters(as independent variable) to existing landslides(as dependent variable). This imperfection of OLS technique, decrease the validity of the outcome. However, the aim of performing this technique was to make challenge for AHP weighting technique with other approaches.
[Table 5.] Comparison of different susceptibility map
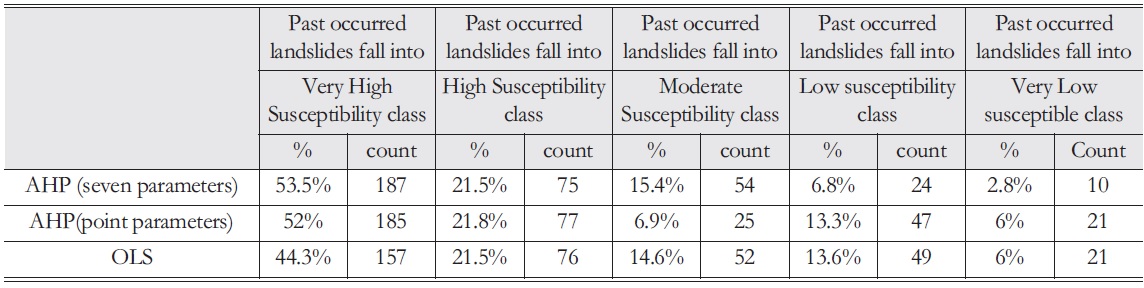
Comparison of different susceptibility map
As conclusion the AHP method is the reliable method that can be used for landslide susceptibility mapping. And also, using more number of parameters contributing in landslide happening, increase the validation and reliability of susceptibility map.
For comparing the results from OLS and AHP using same parameters(four parameters), AHP shows the better result in very high susceptible class(52%), but from low susceptible to moderate class, the number of landslide decreases from 21.8% to 9.6% which shows the invalid result. Actually this problem may be solved by considering more number of factors in landslide susceptibility analysis, like what has been done in the first part of the study applying AHP using seven factors.
Sensitivity analysis was done to evaluate the overall priority of the parameters or objectives. Results of sensitivity analysis for first part of research were acceptable and showed that by changing the degree of preferences for each objective or factor, no significant changes has been occurred on alternatives.