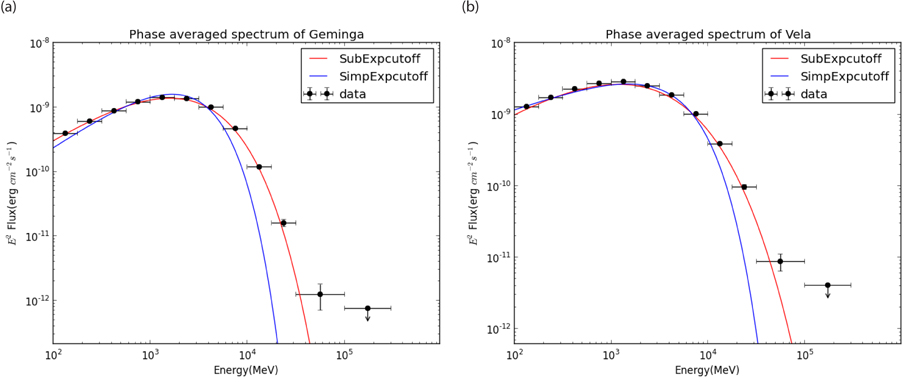
Many pulsar models have predicted that the gamma-ray spectrum of pulsars should have either a simple exponential cut-off (Outer gap models, e.g. Cheng et al. 1986; Hirotani 2008; Takata & Chang 2009) or a simple super-exponential cut-off due to magnetic pair creation (Polar gap models, e.g. Daugherty & Harding 1996). However, the spectra of Geminga and Vela clearly show a sub-exponential cut-off (Abdo et al. 2010a, b). In fact, the sub-exponential spectrum is much more common for gamma-ray pulsars. The nature of the sub-exponential spectrum has been explained by the non-stationary superposition model, in which the observed sub-exponential spectrum results from a superposition of various stationary gap structures (Takata et al. 2016). In this paper, from the data analysis point of view, we would like to determine if the superposition model still works for very fine phase-resolved spectrum.
We first fit the phase-averaged and larger phase-resolved
2. THE PHASE-AVERAGE SPECTRA OF VELA AND GEMINGA
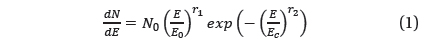
The observed spectra of gamma-ray pulsars are generally described by a power law with sub-exponential cut-off:

The parameters here are the prefactor
The phase-averaged spectra of both Geminga and Vela show sub-exponential cutoff, i.e.,
3.1 Stationary Outer Gap Models
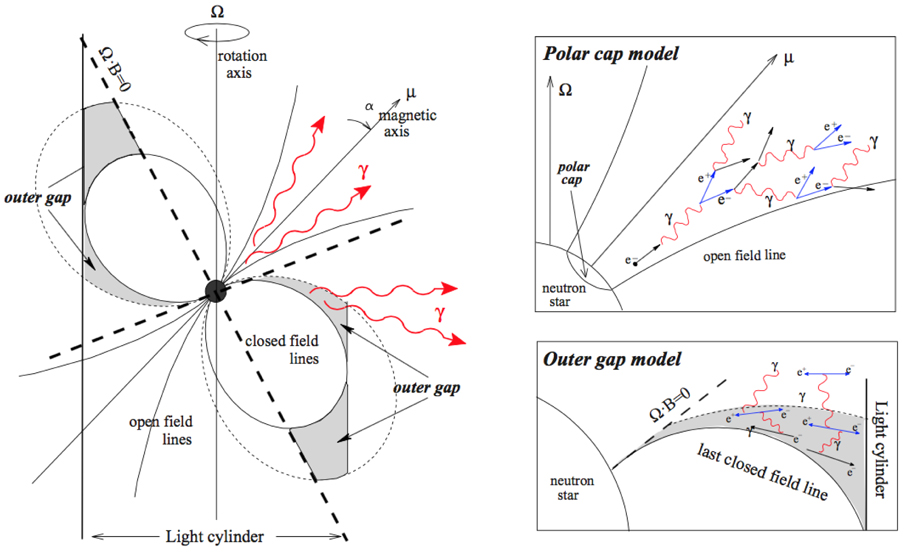
The main difference between the polar cap model (Daugherty & Harding 1994) and the outer gap model (Cheng et al. 1986) is the distinct acceleration region in the magnetosphere of the pulsar (see Fig. 2). The spectral cut-off depends on the emission model. In the polar cap model, particles are accelerated in the polar gap above the polar cap on the pulsar surface and emit curvature gamma rays. Because gamma rays are released in the super strong magnetic field, pair production can take place. In this case, only the secondary photons that survive pair production can escape and be observed. So, the predicted spectrum of the polar cap model is a super-exponential cut-off spectrum.
On the other hand, Cheng et al. (1986) argued that charge depletion regions can be developed in the vicinity of null charge surfaces by the global current flow in the outer magnetospheric regions, in which the electric fields along the magnetic field lines are not zero. Therefore, outer-magnetopserhic gaps (outer gaps) are developed. The inner boundary of the outer gap is near the null charge surface; the outer boundary is at the light cylinder. According to the three dimensional outer gap model (Cheng et al. 2000), even when four outer gaps exist in the plane of (Ω,μ), only the two longer ones can be observed. They argued that those longer shorter gaps are inactive. The outer gap can emit two fan beams; this makes detection of gamma-ray pulsars easier. The observed double pulses actually come from the same fan beam produced by the outgoing particles because the time of flight and the relativistic aberration effect squeeze the emitting photons at the two edges and this results in a double peak structure in the light curve. In this model, there are only very few off-pulse photons, which makes modelling for photons in the off-peak difficult. Tang et al. (2008) showed that the off-pulse can come from the incoming particles because the inner boundary of the outer gap can extend a substantial distance toward the star (Hirotani & Shibata 1999; Takata et al. 2004; Hirotani 2015).
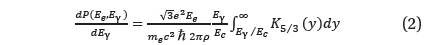
The emission mechanism of the gamma-rays from the outer gap is called synchro-curvature radiation (Cheng & Zhang 1996). This emission process describes the radiation from relativistic electrons moving in spiral trajectories along curved magnetic field lines. For a small pitch angle, the synchro-curvature spectrum can be approximated by the curvature radiation spectrum:

where K5⁄3 is the modified Macdonald function.

where is the distribution spectrum of electrons. For mono-energetic electron distribution

This is the characteristic of pure curvature spectrum. The observed spectra of Geminga and Vela show a sub-exponential cut-off (
3.2 Non-Stationary Outer Gap Model
Takata et al. (2016) proposed a non-stationary model to explain the origin of the sub-exponential spectrum of gamma-ray pulsars. In the non-stationary model, Takata et al. (2016) suggested that the gap structure and
In the non-vacuum outer gap model, the properties of the accelerators are determined by the thickness of the outer gap: smaller acceleration region and fainter gamma-ray emission are produced by a thinner outer gap. Considering the electrodynamics, the gap thickness is adjusted by the external current injection and the following cascade processes. Hence a thinner outer gap occurs with a larger injection rate and vice versa.
Kramer et al. (2002) pointed out that the radio emission averaged over a longer timescale is stationary, whereas the individual pulsed emission varies on a much shorter timescale. In the observations, the variation of timescale ranges from milliseconds to seconds for a single pulse.
Takata et al. (2016) assumed that the injected current obeys a simple power law distribution with

where

In the above distribution, if

The superimposed spectrum is given by

where
In the non-stationary outer gap model, since the timescale required to construct a spectrum is much longer than the timescale of the gap dynamical, the observed spectrum is actually the time average of the dynamical gap. For each dynamical timescale, the spectrum is a simple exponential spectrum. Here we assume that:
(1) A sub-exponential spectrum is the result of superposition of simple-exponential spectra, and in each dynamical timescale, the simple exponential spectrum has an arbitrary cut-off energy.
(2) This arbitrary cut-off energy follows a power-law distribution as a result of dynamic gap fraction.
(3) Power index is determined by data fitting.
Also, divided the Vela and Geminga into 19 and 33 phase bins respective to test if when the bin is small enough, then it can be described by a simple-exponential spectrum. If these phase bins cannot be described by a simple-exponential spectrum and a sub-exponential spectrum might still be necessary, it would mean that non-stationary states exist even down to the very fine phase bins. In the case of Vela there are very low photon fluxes in the off-peak region, so we did not include the off-peak of Vela in our analysis.
4.1 Fitting Results for Geminga
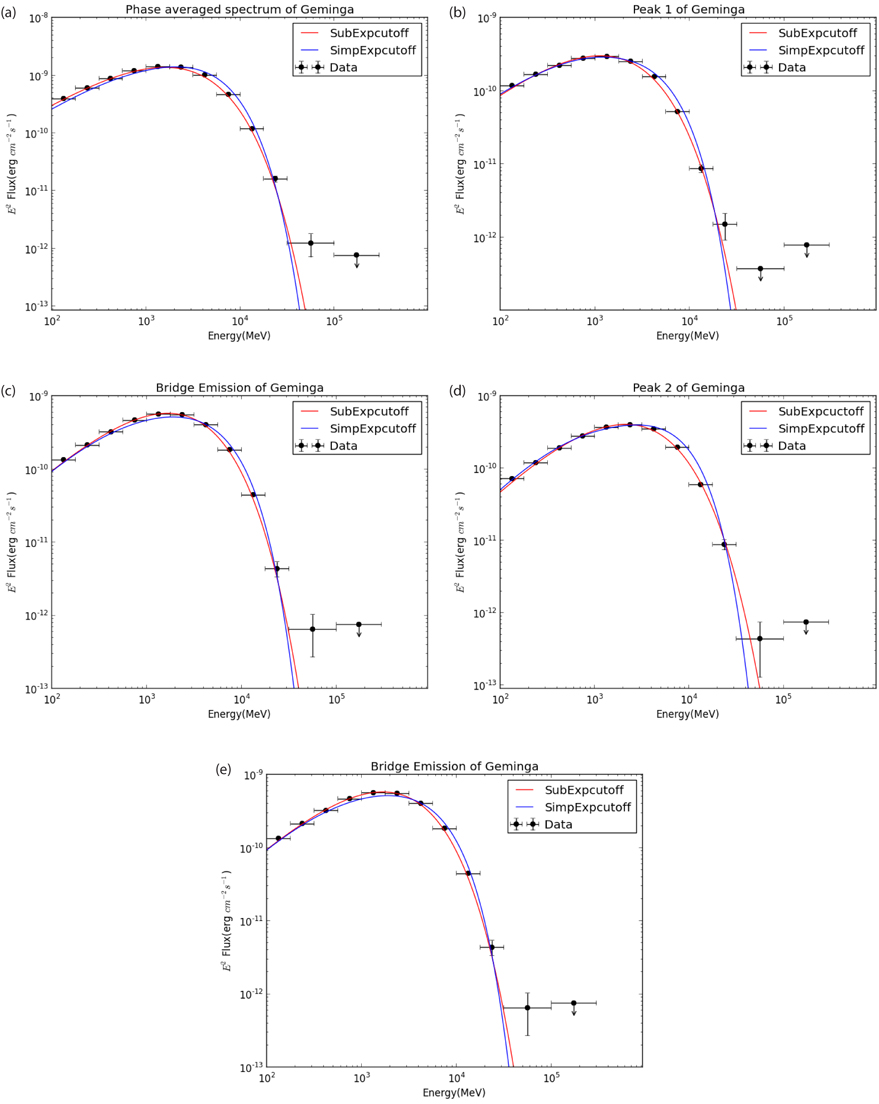
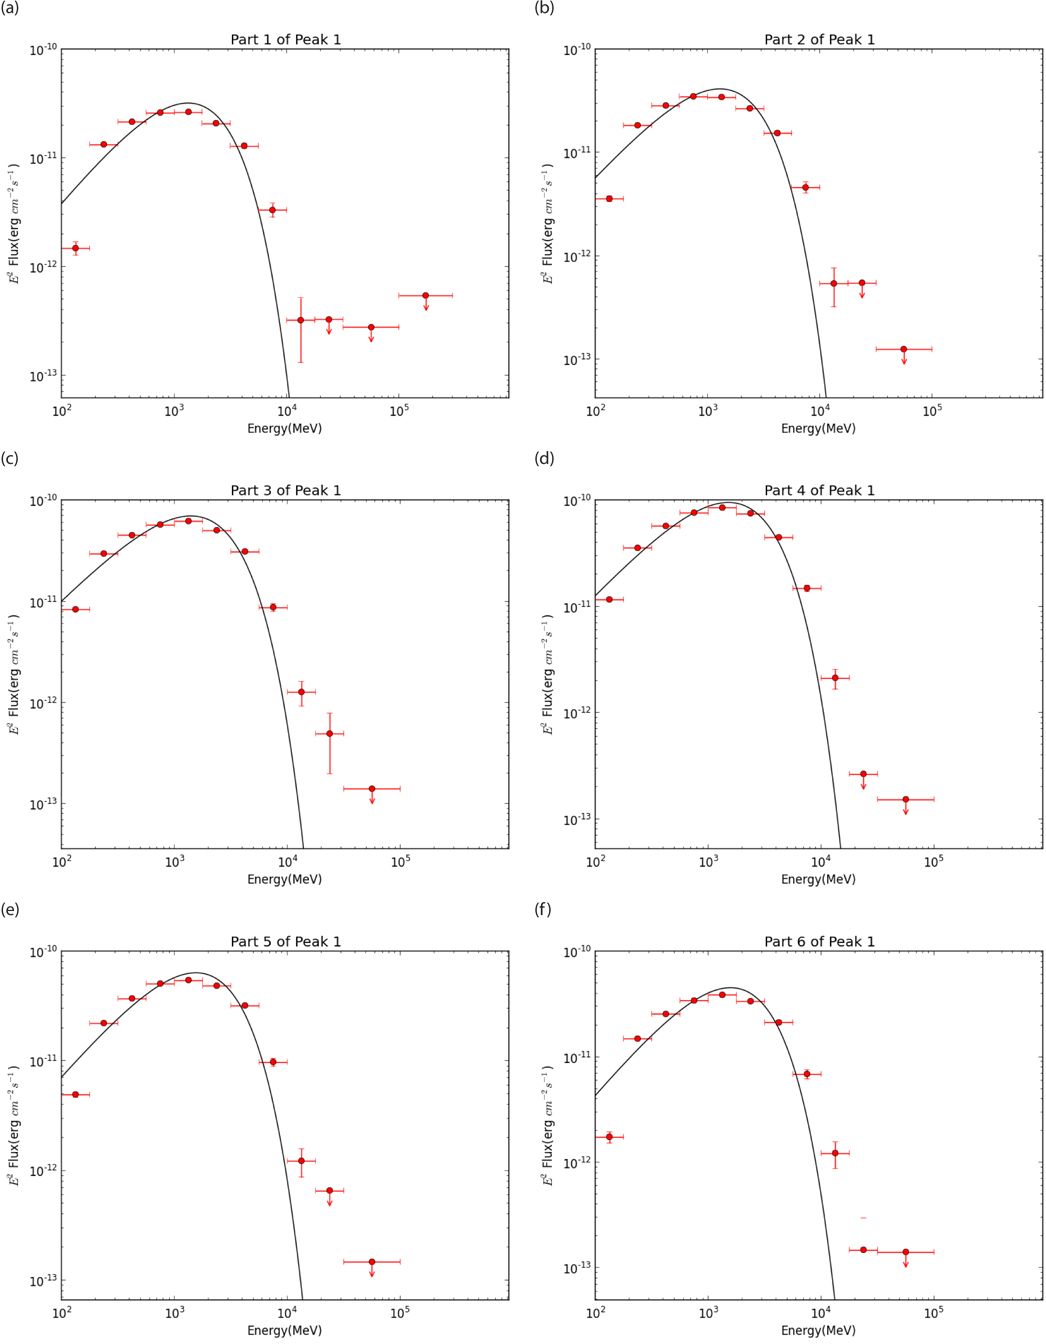
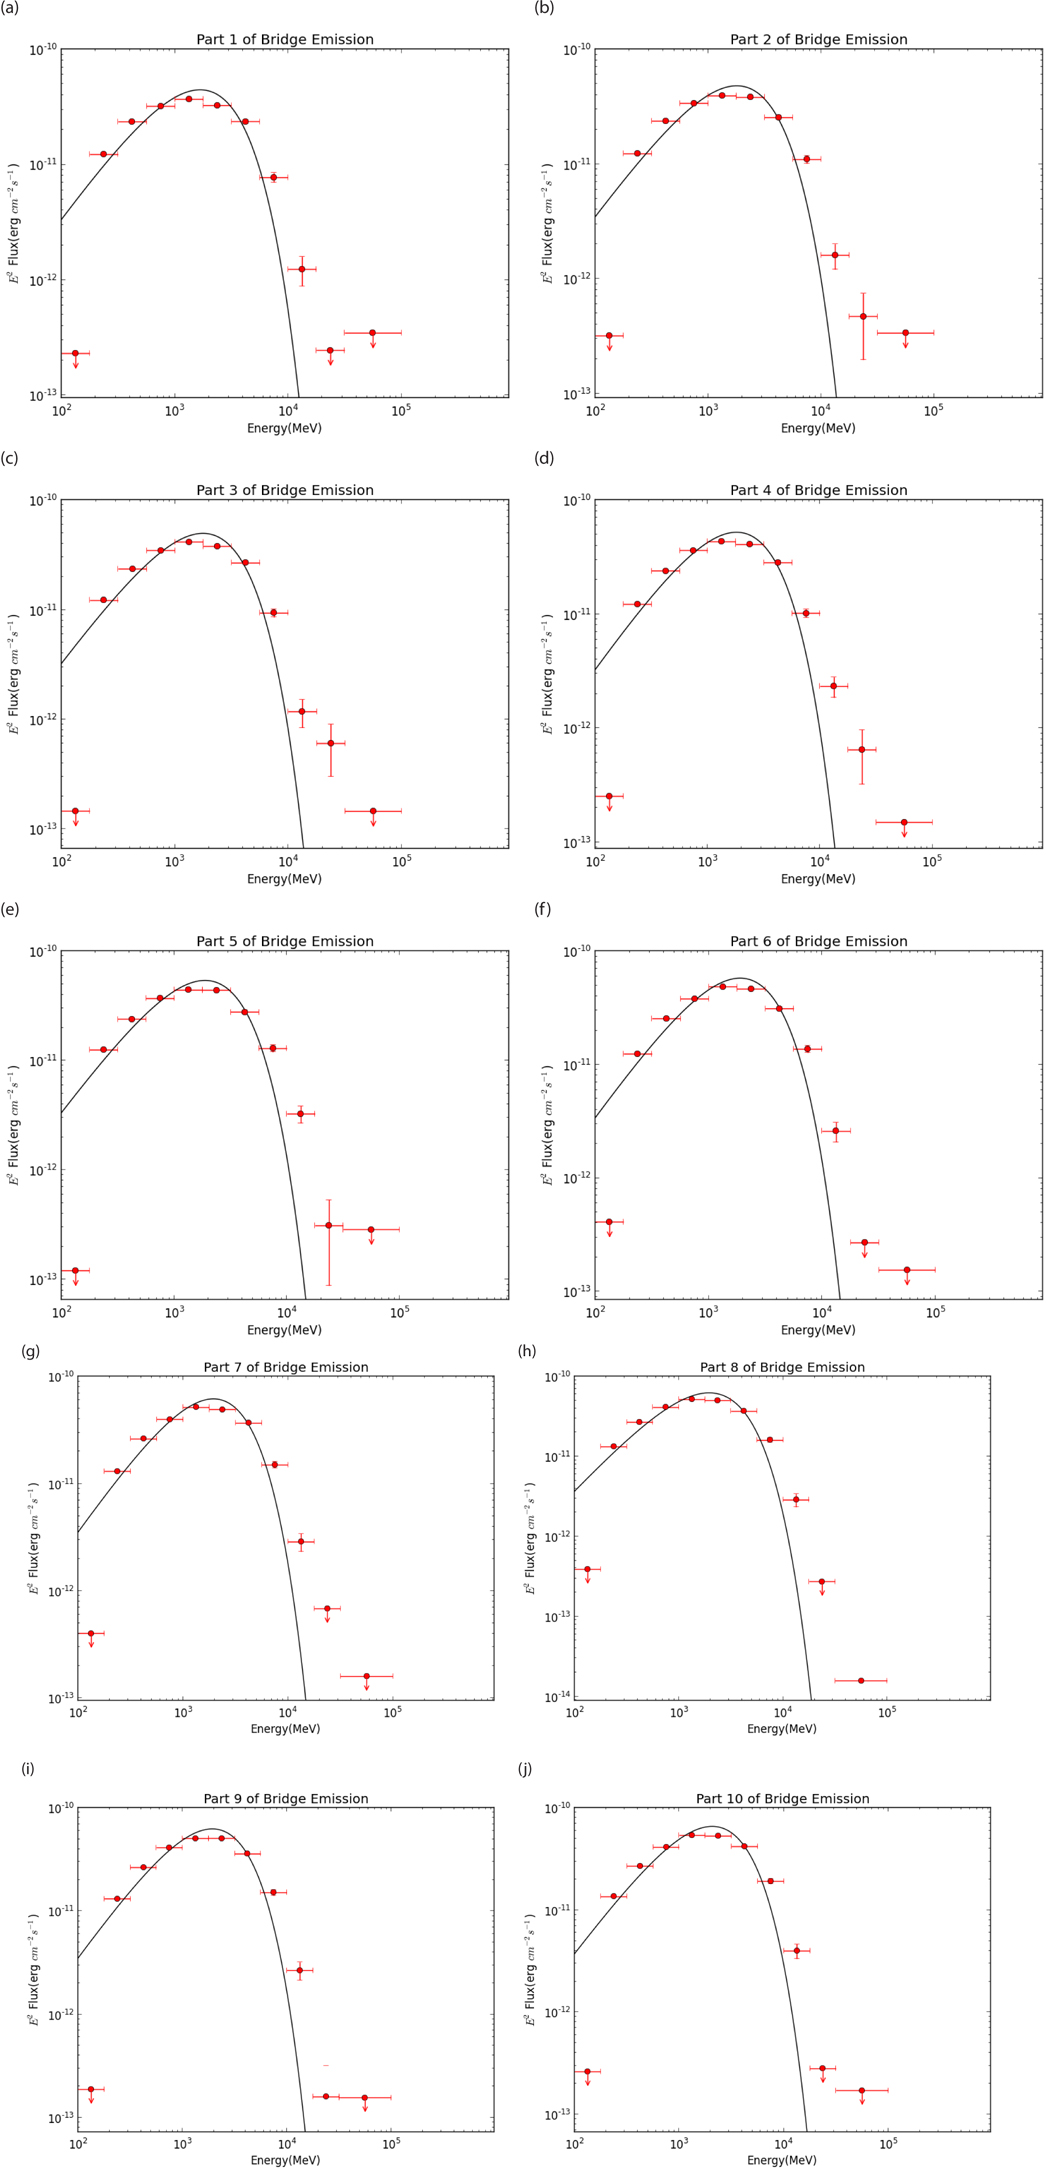
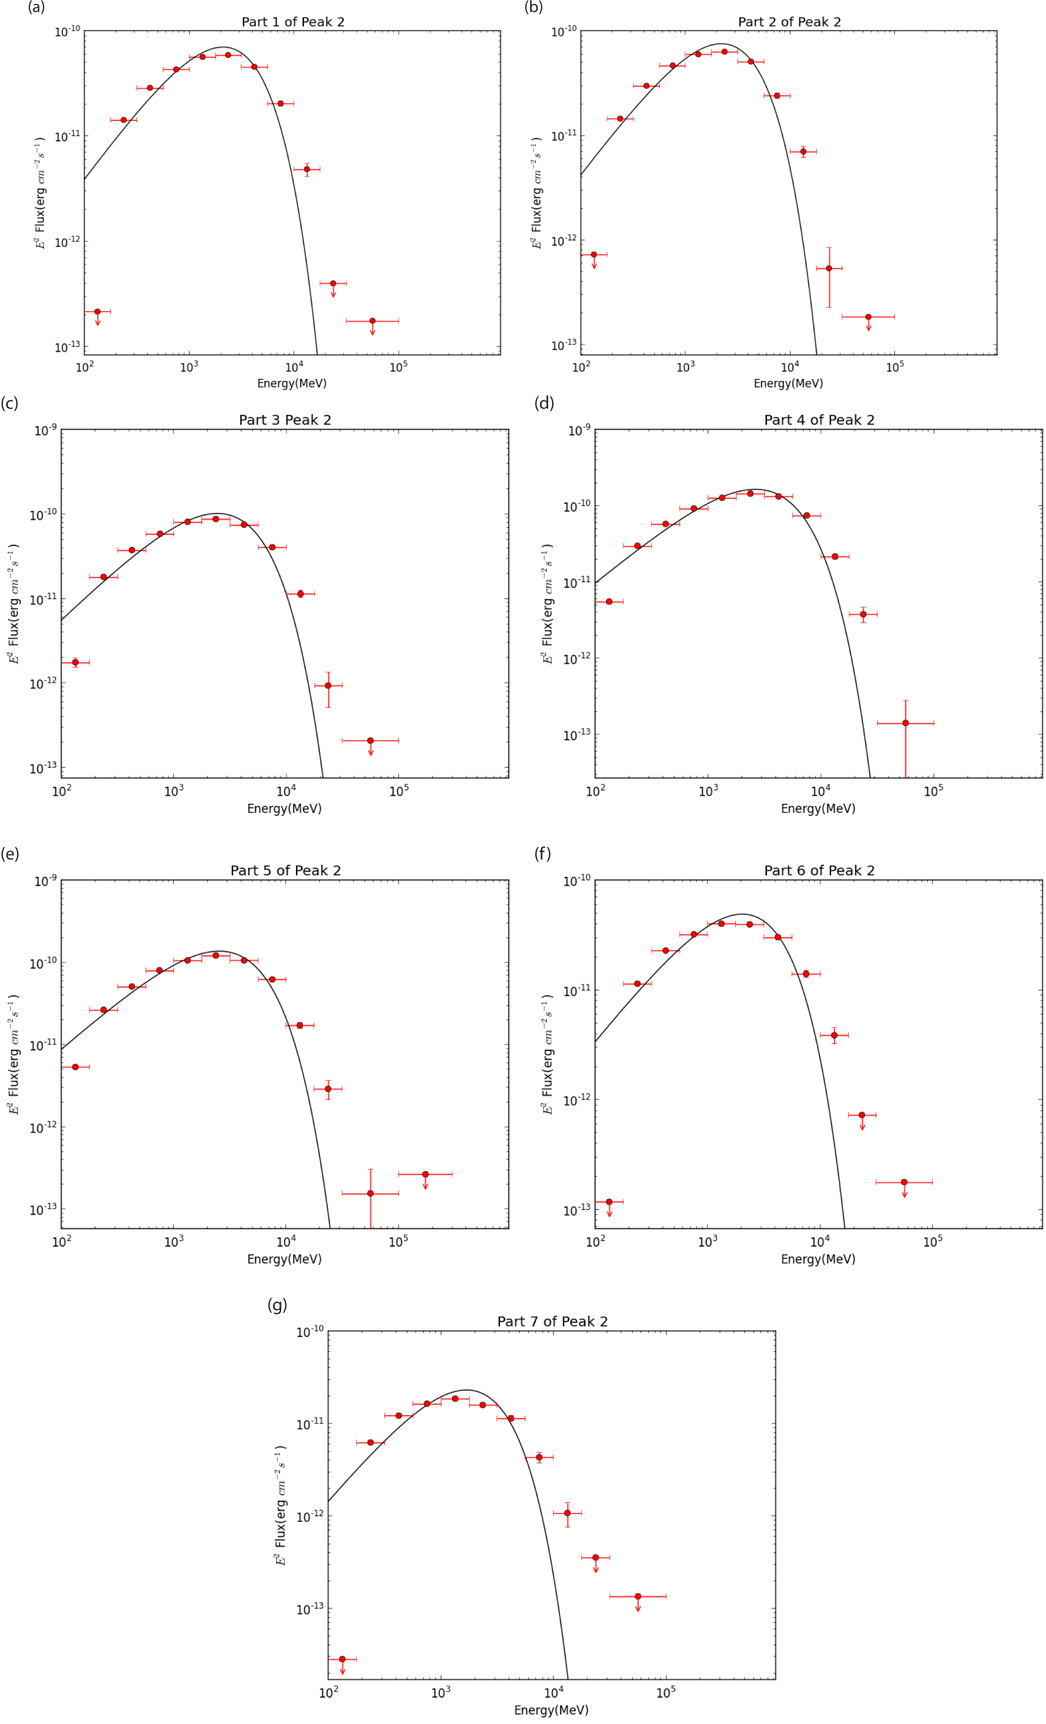
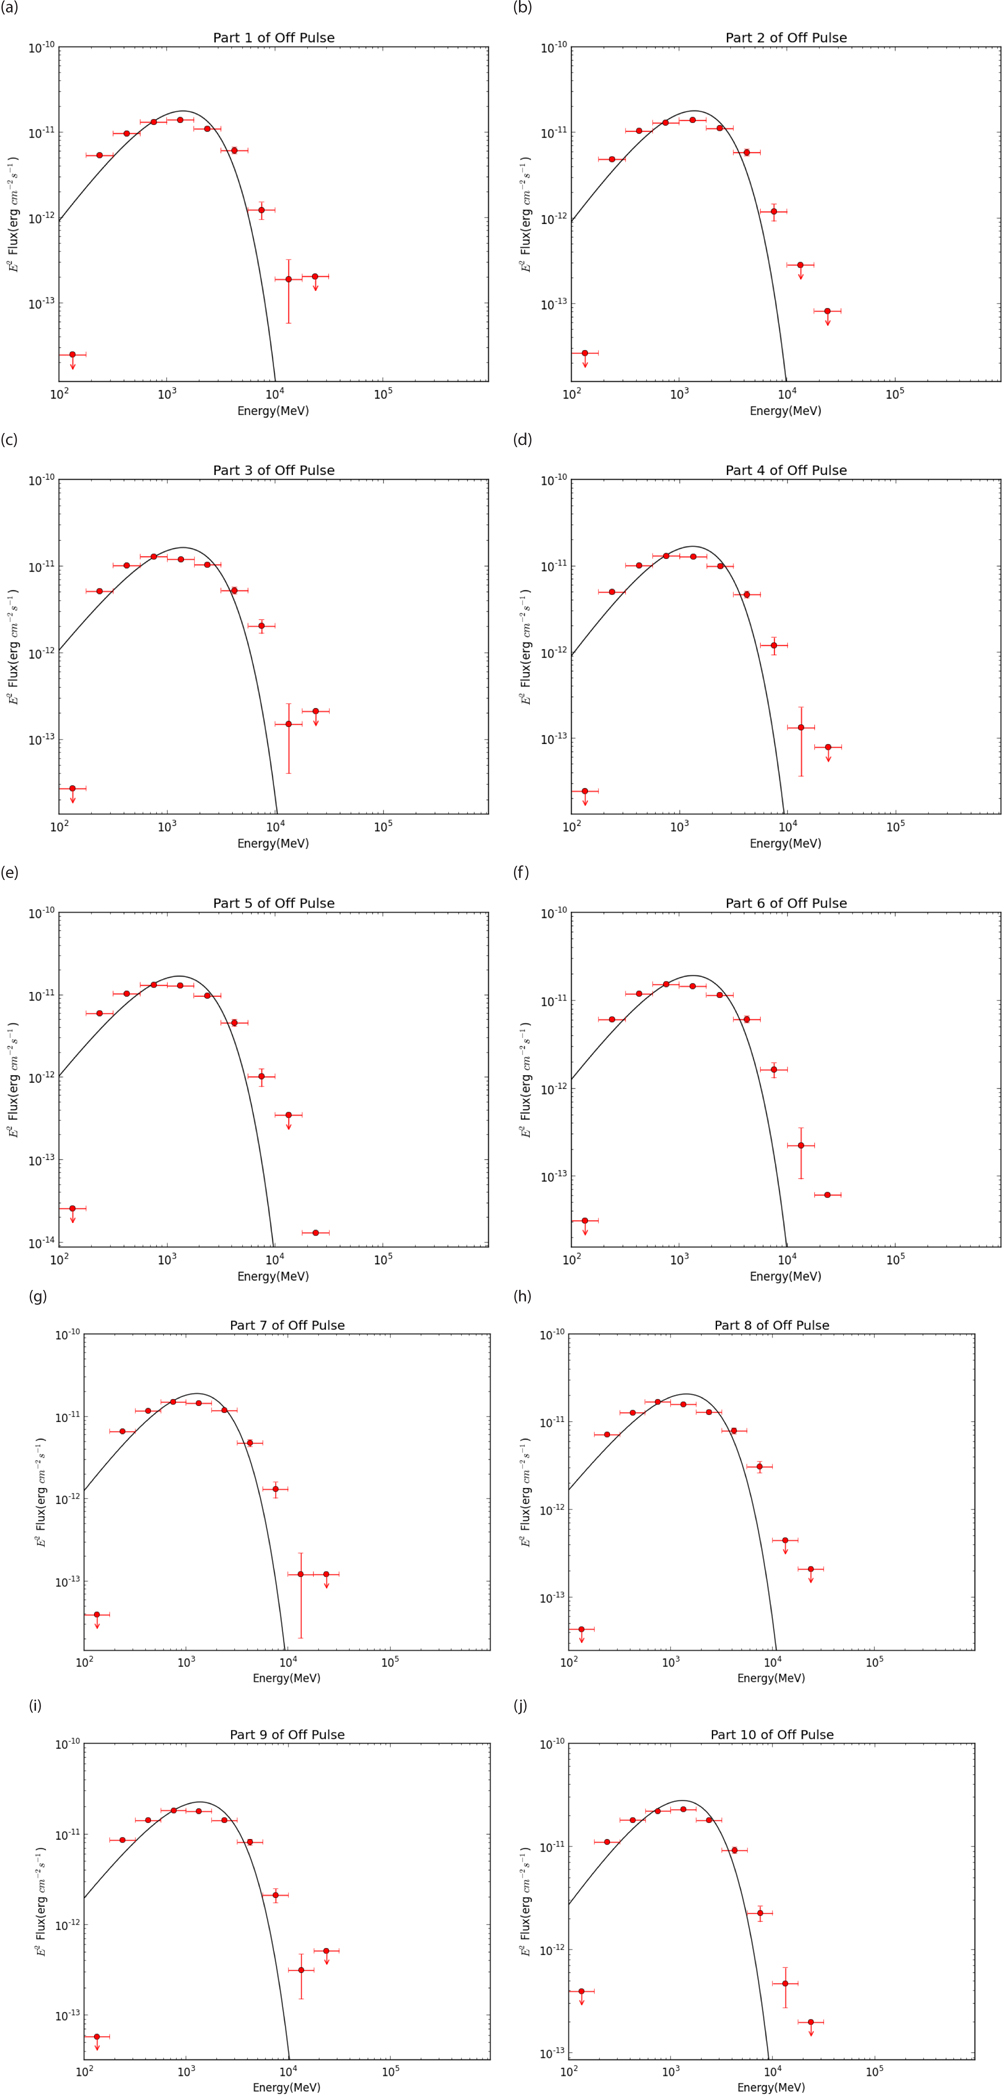
We choose six different cut-off energies arbitrarily for each phase (see Table 1) to represent the non-stationary model; both the phase-resolved spectra and the phase-average spectrum can be fitted by the same power index: 0.29 (see Fig. 3). Next, we divided each phase to make it as small as possible: peak 1 was divided into 6 parts; bridge emission was divided into 10 parts; peak 2 and off pulse were divided into 7 parts and 10 parts, respectively (see Figs. 4-7).
[Table 1.] Parameters of Equation (5) for Geminga and six arbitrary cut-offs

Parameters of Equation (5) for Geminga and six arbitrary cut-offs
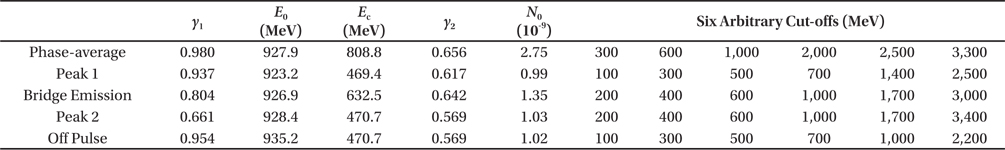
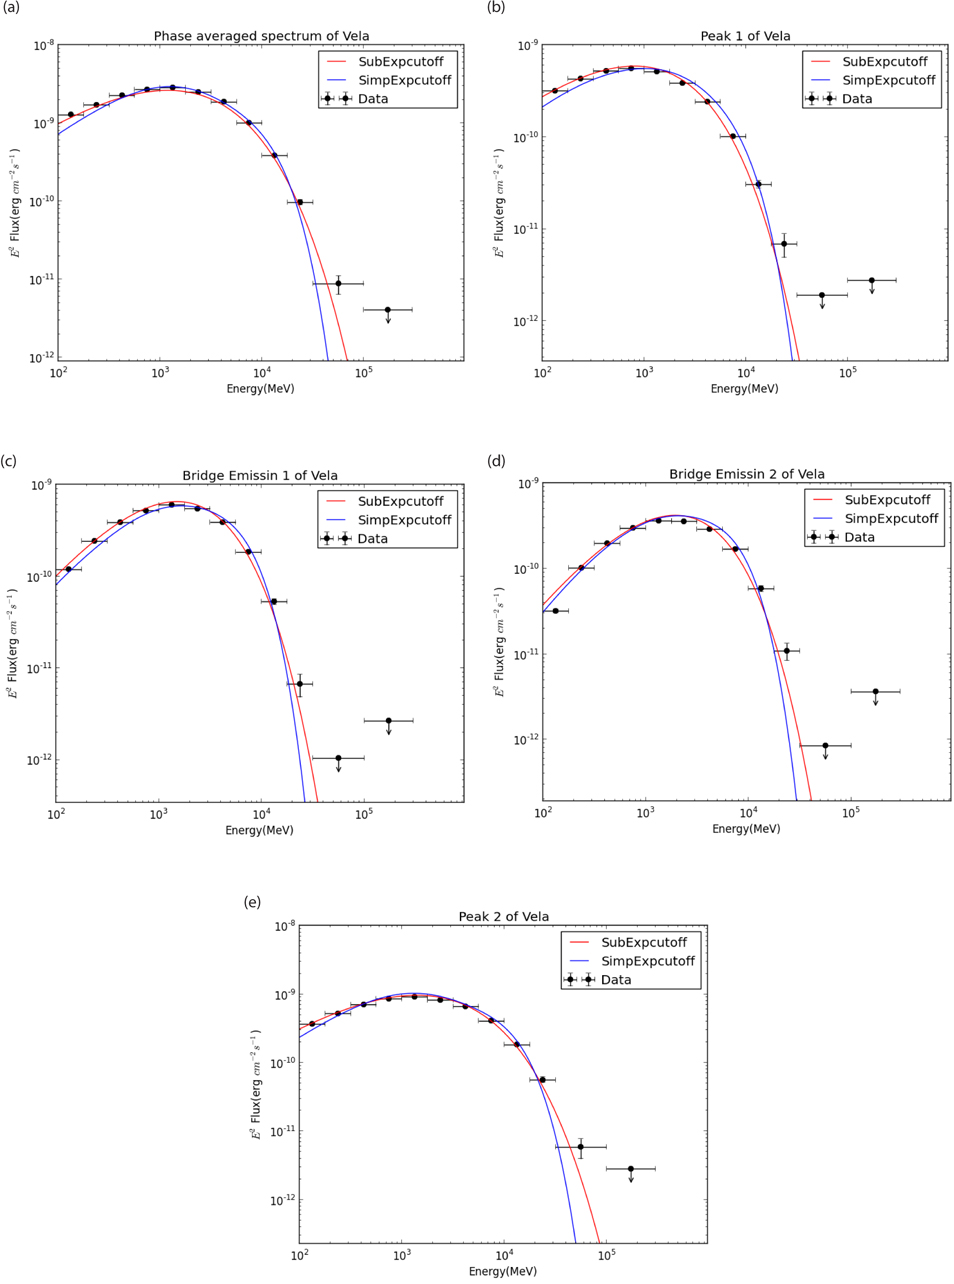
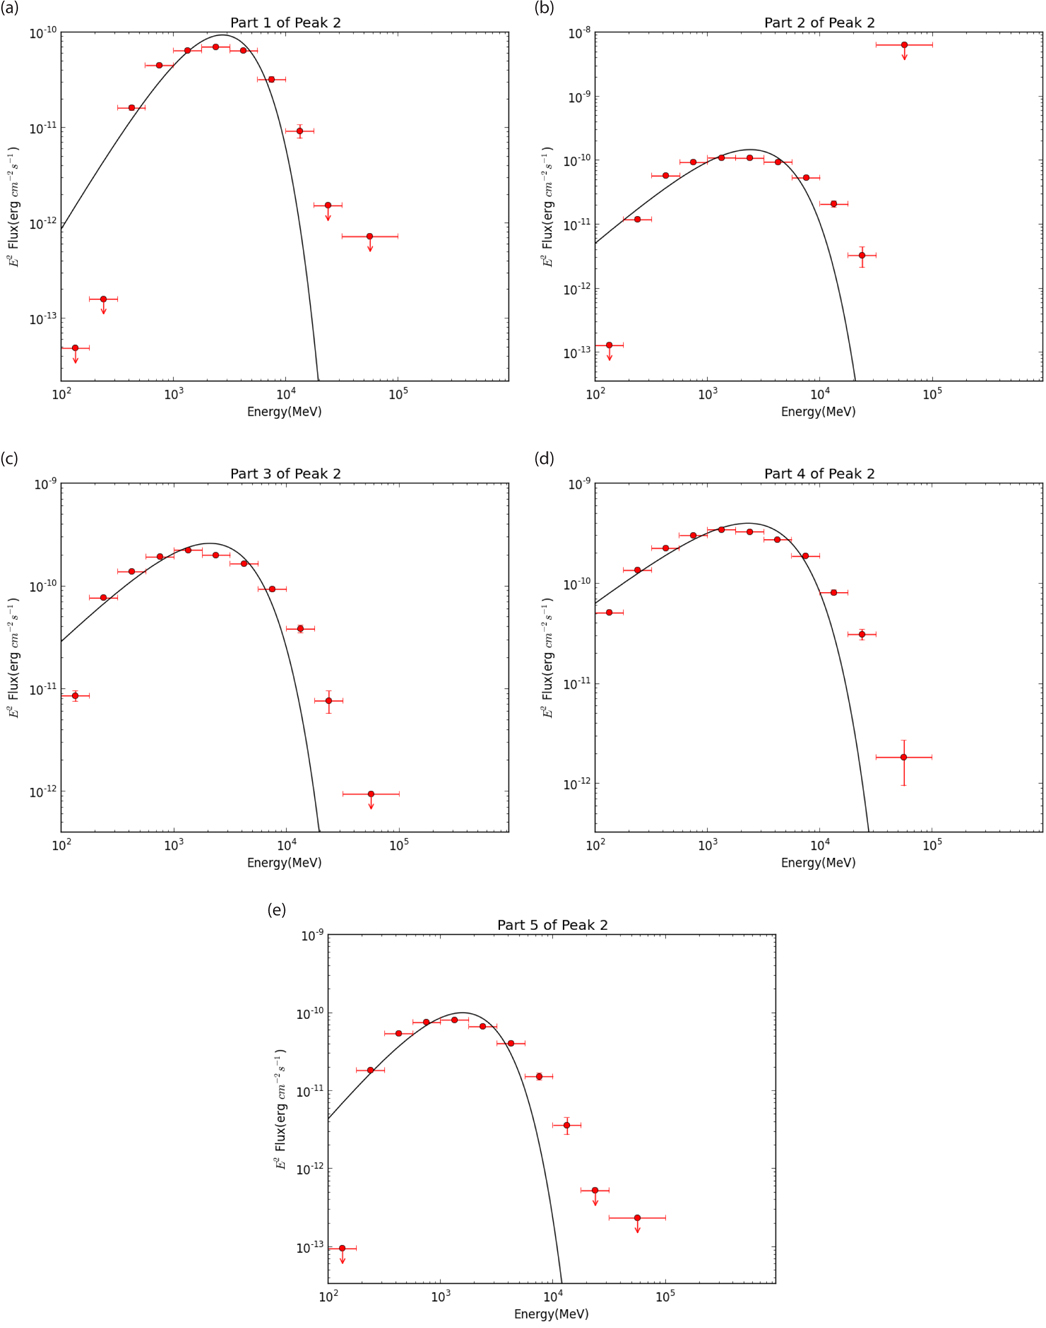
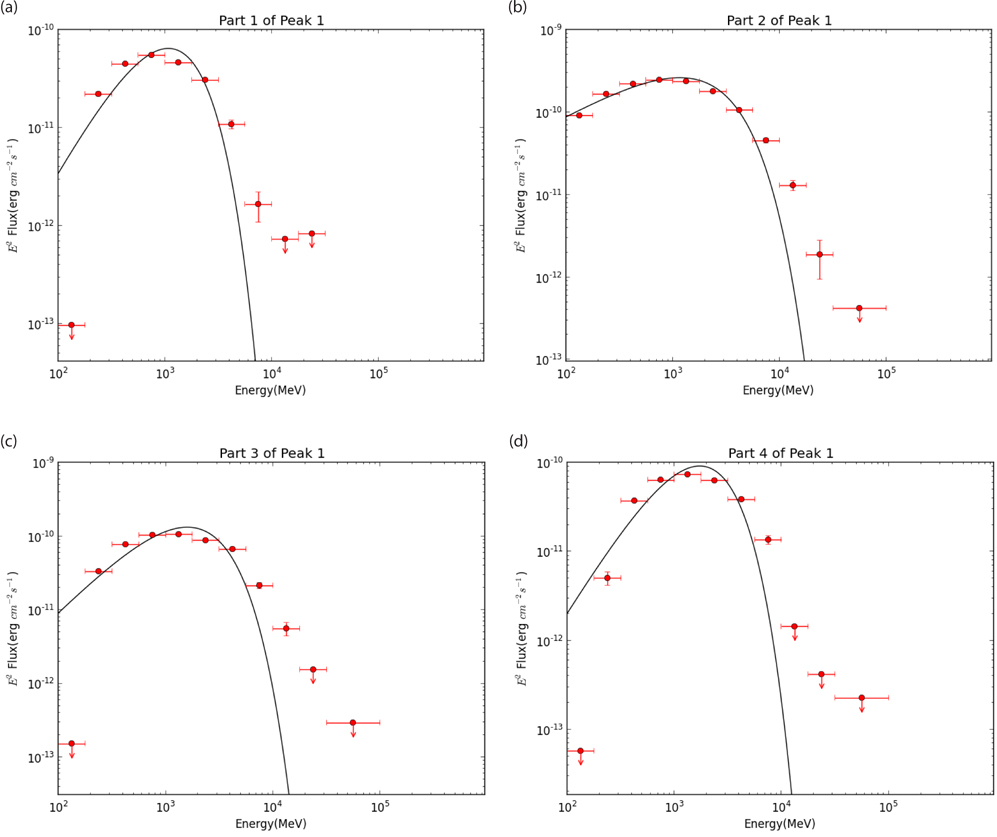
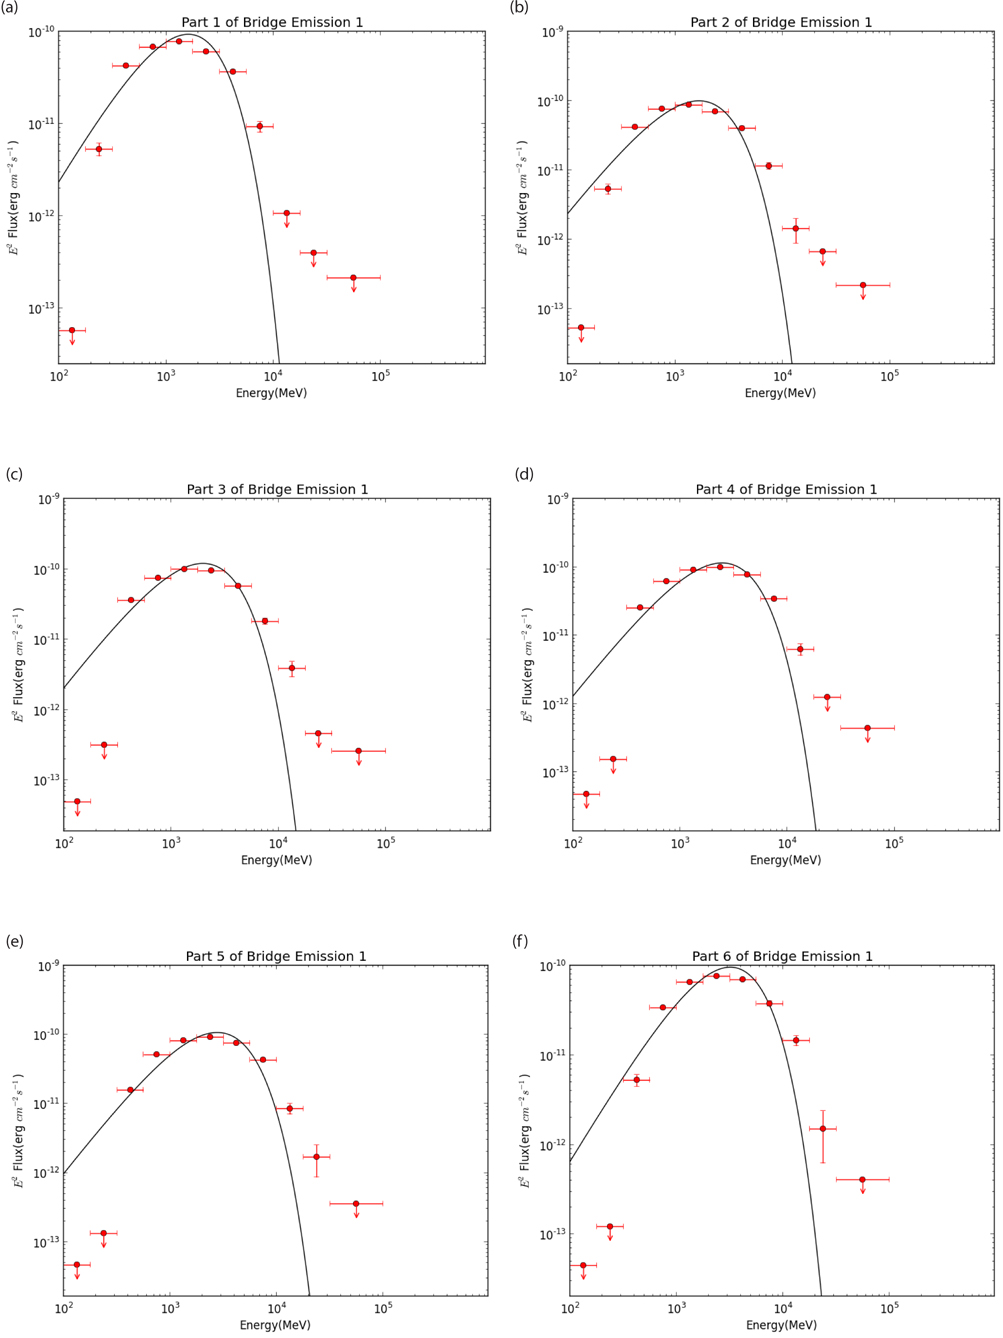
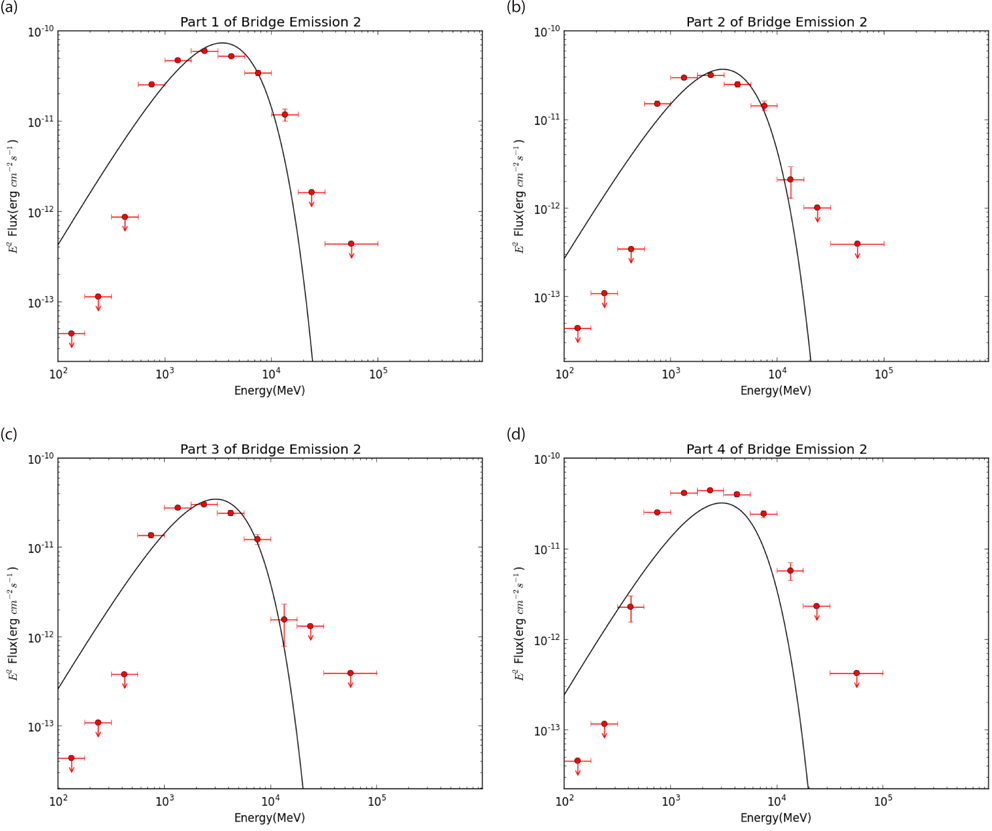
Again we chose six different cut-off energies arbitrarily for each phase (see Table 2), and it was possible to fit both the phase-resolved spectra and the phase-averaged spectrum by the same power index of 0.37 (see Fig. 8). Off pulse was not included because of the very low photon flux. We divide the pulse phases of Vela as follows: peak 1 was divided into 4 parts; bridge emission 1 was divided into 6 parts; bridge emission 2 and peak 2 were divided into 4 parts and 5 parts, respectively (see Figs. 9-12).
[Table 2.] Parameters of Equation (5) for Vela and six arbitrary cut-offs
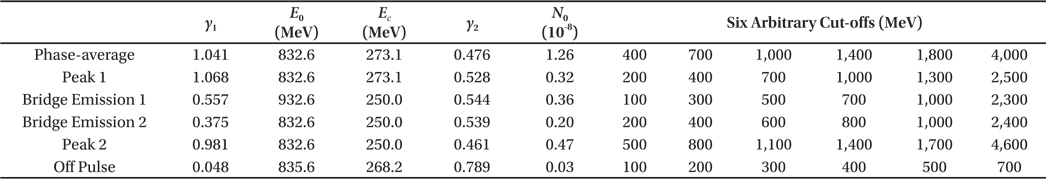
Parameters of Equation (5) for Vela and six arbitrary cut-offs
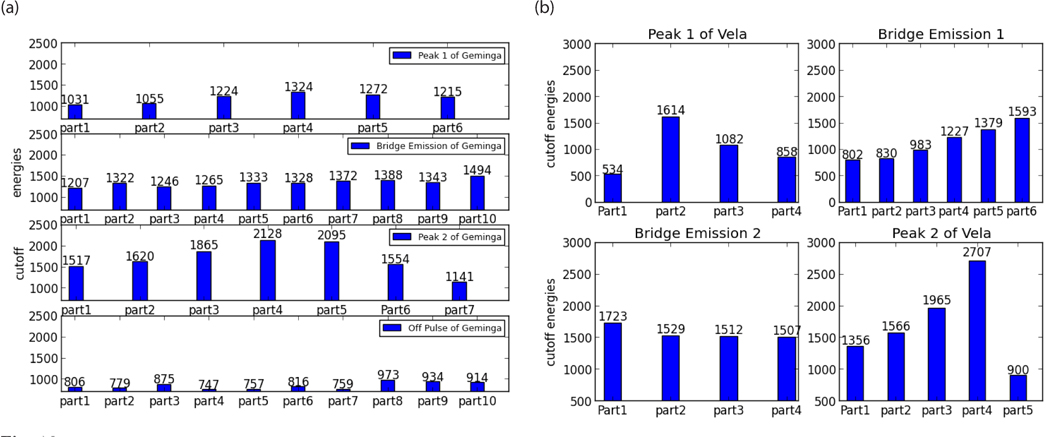
From our fitting results, phase-averaged and phase-resolved spectra of Geminga and Vela can be fitted well by the Non-Stationary Superposition Model. In fact, the same power index can be applied to both the phase-average and phase-resolved cases. Specifically, we find that the power index for Geminga is 0.29 and the power index for Vela is 0.37. In the very fine bin fits, we use a simple exponential spectrum to see if a non-stationary situation exists. The cutoff energies for each fit are given in Fig. 13.
In summary, only 33.3% of the phase bins for Geminga and 26.1% of the phase bins for Vela can roughly be fitted by a simple-exponential cutoff spectrum. Although we have not carried out the sub-exponential fit for these tiny bin cases, we can see that the error bars are in general larger than those for the large phase bin cases, so the sub-exponential cut-off can also be fitted for all cases. It has been argued that the sub-exponential spectrum may result from the fact that the observed spectrum actually consists of contributions from many different emission regions of the magnetosphere, and that each region has its own characteristic cut-off energy (e.g. Viganò & Torres 2015). However, from the three dimensional pulsar magnetospheric calculations (e.g. Tang et al. 2008), the emission regions are known to be mainly from two spatially well-separated regions, one near the star and the other near the light cylinder. A continuous distribution of the cut-off energies seems impossible. On the other hand, a distribution of the injected current results in a distribution of the cut-off energy, which appears to be more physically possible. Although we cannot test this scenario in gamma-rays due to their relatively long arrival time interval, short term time fluctuations are indeed observed in radio observations. Therefore, we can conclude that the superposition of the cut-off energy is more likely the consequence of non-stationary states.