Due to the recent signing of the free trade agreements between countries, the importance of the logistics industry to transport a wide range of products has emerged. Various instructions have been made with the type of product to ensure reliable transport of the product. In the case of temperature-sensitive drugs like vaccines, the World Health Organization (WHO) has enacted the “Guidelines on the international packaging and shipping of vaccines” [1] and recommended that the guidelines should be included in the technical specifications and requirements. The WHO has classified each type of vaccine and indicated the minimum and maximum allowable temperature to which vaccines may be exposed during international logistics time of at least 48 hours. Thus, all vaccine manufacturers are expected to ensure that their packaging complies with the criteria specified in the guidelines.
In order to satisfy the guidelines, both active system and passive system have been used for vaccine packaging and shipping. Unlike the active system to keep a constant temperature by using electric power, the passive system is using only pure physical properties of packaging materials composed of insulation and refrigerants to maintain the temperature. Through the use of the phase change materials (PCMs), which are eco-friendly, non-toxic and recyclable, the performance of the passive system can be improved as much as the performance of the active system. Therefore, the insulation package using the PCM has been actively developed. The PCM, which has a melting point of 2 to 8 ℃, is useful for the packaging and shipping of vaccines. Recently, paraffin waxes have become emerging candidate materials to be used as PCMs since they do not show a tendency to segregate, are chemically stable, safe, non-reactive, compatible with all metal containers, and can easily be incorporated into a heat storage system with a high heat of fusion [2]. Furthermore, they also exhibit no tendencies to super cooling. Thus, nucleating agents are not required.
In this study, we focus on predicting the internal temperature changes that occur during vaccine package transport via the modeling and simulation of heat transfer in an insulated box containing PCMs. Both n-tetradecane and water are used as PCMs. The heat transfer accompanying the phase transition has been regarded as a difficult problem because the non-linear phasetransition boundary is moving with time. Several techniques such as finite difference method (FDM), finite element method (FEM), control volume, and the approaching boundary element method have been reported [3-12] with the use of thermal energy equations [13]. In our previous study, we used water in the modeling and simulation of heat transfer inside a packaging container utilized for vaccine shipping [14]. The simulation results showed good agreement with experimental data during the cooling process, but the model did not successfully simulate the heating process. Although a basic algorithm for simulating heat transfer through multi-slabs combined with different materials including phase-change material (PCM) has been successfully developed, the results show that water is not suitable for use due to its lower melting temperature (~0 ℃). Thus, this study proves the effectiveness of using n-tetradecane as a PCM inside a packaging container utilized for vaccine shipping.
N-tetradecane (99%) was purchased from Kanto chemical Co., Inc. Ethyl alcohol was received from Samchun Pure Chemical Co., Ltd. Water was got from J. T. Baker. T-history method was performed in a chiller (HST-205 WL, Han Bsek St Co., Ltd.) and recorded by Testo 175 H. Polyurethane foam (PUR, Thermo Safe Model No. E36) was used as container in this study.
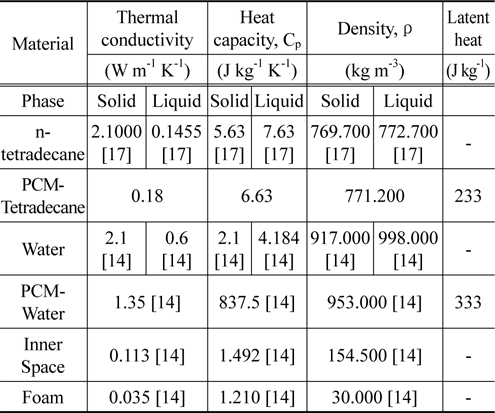
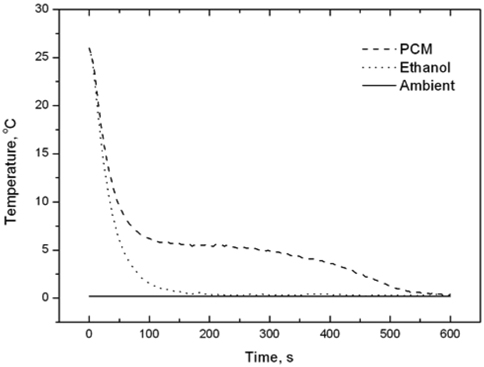
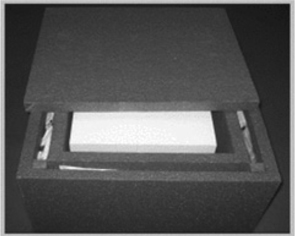
We first measured the thermo-physical properties of ntetradecane and ethyl alcohol. The thermo-physical properties of n-tetradecane were characterized using an improved T-history method [15] in a chiller in the temperature range from 26 to 0 ℃ with a thermocouple (length of 110 mm, diameter of 0.4 mm), tubes (PCM length of 120 mm, tube length of 150 mm, tube diameter of 1 mm), and recorder. Ethyl alcohol was used as the reference material [16]. The solidification curves of ntetradecane and ethyl alcohol are shown in Figure 1. The phasechange temperature of n-tetradecane can easily be deduced from the improved T-history method curve, with relevant parameters being summarized in Table 1. Figure 2 illustrates a model packaging container for vaccine shipping. Two insulating containers of different sizes were used together in this study. The insulating container used in this study is depicted in Figure 2, and its description is tabulated in Table 2. We note that the space thickness between the two containers is 0.03 m.
[Table 1.] Physical properties for simulation

Physical properties for simulation
[Table 2.] Descriptions of insulating containers used in this study
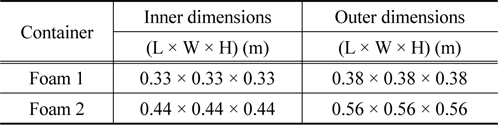
Descriptions of insulating containers used in this study
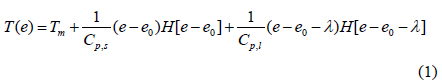
The heat transfer accompanying the phase transition is a moving boundary problem in which the non-linear phase-transition boundary is moving with time. In order to effectively solve this problem, we used the energy method [13]. This method used energy and temperature as two variables in the heat transfer equation. The internal energy and temperature of materials have the following relation:

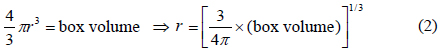
where T is the temperature, Tm is a melting point, e is the energy, Cp,s is a heat capacity of solid, Cp,l is a heat capacity of liquid, λ is a latent heat, and H is a step function. MS-Fortran Power Station, which was incorporated with an International Mathematical and Statistical Libraries (IMSL) subroutine, was used for the simulation of heat transfer inside the packaging container. The modeling was performed following a previous study [14]. To provide a brief overview of the process, the containers’ three-dimensional rectangular geometry was converted into a one-dimensional spherical model. The conversion was carried out using the following Equation (2):

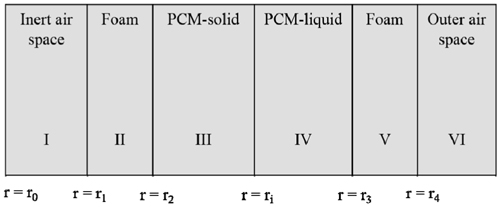
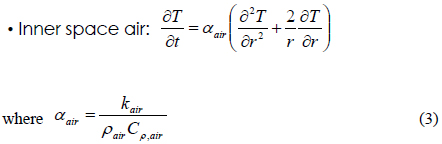
Meanwhile, the basic assumptions for this modeling are summarized via the three following descriptions. First, all the rectangles inside the container were converted into equivalent spheres. Second, heat transfer in the inner space of the container was assumed to occur via thermal conduction. Third, although the physical properties such as the heat conductivity, thermal capacity, and density actually vary with respect to temperature, they were assumed to have constant values. The scheme describing our simple model is shown in Figure 3, and the geometrical description of the actual container is tabulated in Table 3.
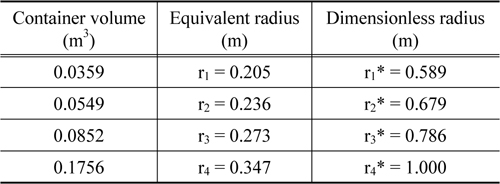
Container geometry
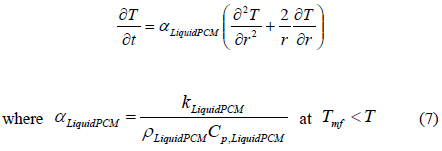
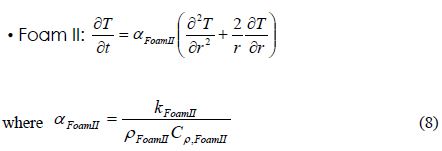
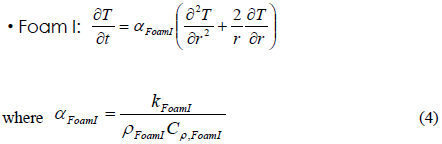
The overall heat transfer equation can be written with the use of the following equations. The heat transfer equation at each section of the packaging container is written as follows:
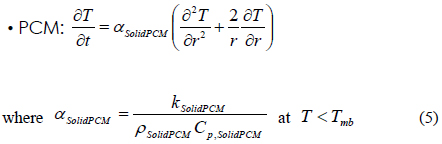
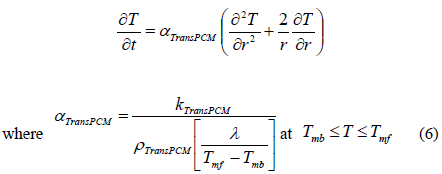


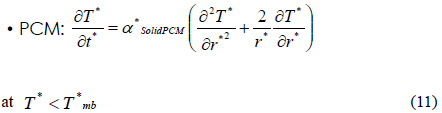
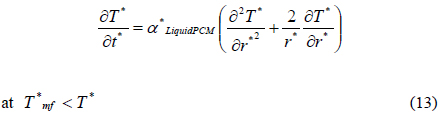
In the above Equations of (5) to (7), we consider the phase transition of a PCM after dividing the PCM into three regions such as a solid state (SolidPCM), a transition state (TransPCM), and a liquid state (LiquidPCM), with respect to temperature. In particular, the PCM at a transition state represents the change of thermal heat capacity during phase transition as a function of latent heat. Using Equation (1), the effect of latent heat on heat transfer can be reflected in the heat transfer accompanying phase transition.
The initial and boundary conditions for solving these equations are as follows:
• Initial condition:
• Boundary conditions: at
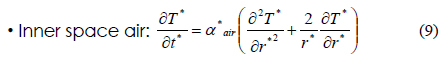
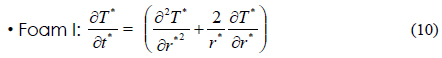
Dimensionless variables are used for solving the above equations. These variables are defined as follows:
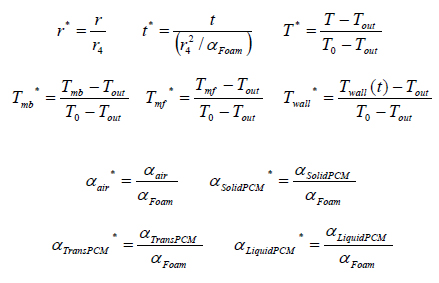
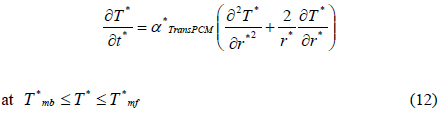
Consequently, the heat transfer equations are rewritten using the dimensionless variables as below:


The corresponding initial and boundary conditions are also rewritten as follows:
• Initial condition:
• Boundary conditions: at
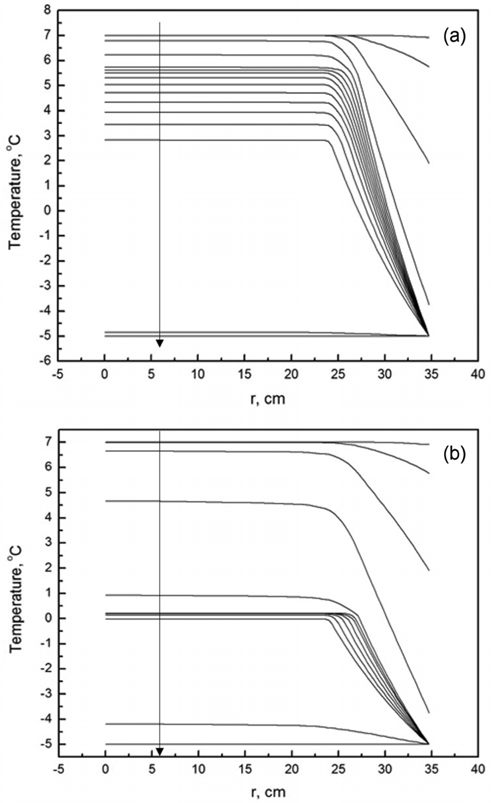
We firstly investigate the temperature profiles at various time domains during the cooling process. The temperature profiles at different times are shown in Figure 4. This simulation was performed with the following initial and melting conditions:
T0 = 7 ℃ and Tout = −5 ℃ Tmb = 2.48 ℃ and Tmf = 5.64 ℃
where T0 represents the initial internal temperature, Tout the external temperature or outside temperature, Tmb the temperature at which melting begins, and Tmf the temperature at which melting ends. These values of T0 and Tout were fixed, while the values of Tmb and Tmf were measured via the improved T-history method. Figure 4 shows the temperature change with respect to various positions (with the distance r being measured from the center to the wall, as seen in Figure 3) in the box calculated at various times during the cooling process. The lines from top to bottom indicate temperature profiles calculated at various times. Each line corresponds to a temperature profile within the container. In order for the box to be used as a container suitable for the packaging and shipping of vaccines, the phasechange materials must be firstly required to have a melting temperature in the range of 2 to 8 ℃. Secondly, the coldest temperature of the vaccine is not below +2 ℃ with continuous exposure at an external temperature of −5 ℃ for a period of at least 48 h [1]. Figure 4 shows the temperature profiles in the box calculated at various times for both n-tetradecane (Figure 4(a)) and water (Figure 4(b)). From Figure 4(a), we note that the temperature profiles do not change at positions in the range from 0 to 27.3 cm. However, beyond 27.3 cm, the temperature quickly decreases to −5 ℃ due to heat transfer through the different insulation materials in the box (Figure 3). In the beginning stage up to 0.35 h, there are no obvious temperature changes with change in the position for both n-tetradecane and water. However, in the case of n-tetradecane, the inside temperature measured below r = 27.3 cm gradually decreases from 7 to 2.84 ℃ until 78 h, while the outside temperature measured for distances greater than r = 27.3 cm starts to quickly decrease up to −5 ℃ until 8.7 h, as can be observed from Figure 4(a). This result indicates that the box can be an appropriate insulation candidate during the cooling process for packaging and shipping of vaccines. These results are in good agreement with T-history data in Figure 1. In the case of water, both the inside and outside temperatures in the box also decrease in a pattern similar to that exhibited by n-tetradecane. However, the inside temperature quickly reaches 1 ℃ even at 8.7 h. This result indicates that the cooling rate inside is considerably faster up to 8.7 h, unlike in the case of n-tetradecane (Figure 4(b)). From Figure 4(b), we also note that there is no marked difference in the inside temperature for positions of r < 25 cm during the cooling process from 12.52 to 42.09 h. This is because of the heat transfer resistance due to the phase change of water. This result indicates that water cannot be a proper insulation material during the cooling process in packaging and shipping of vaccines as per WHO guidelines.
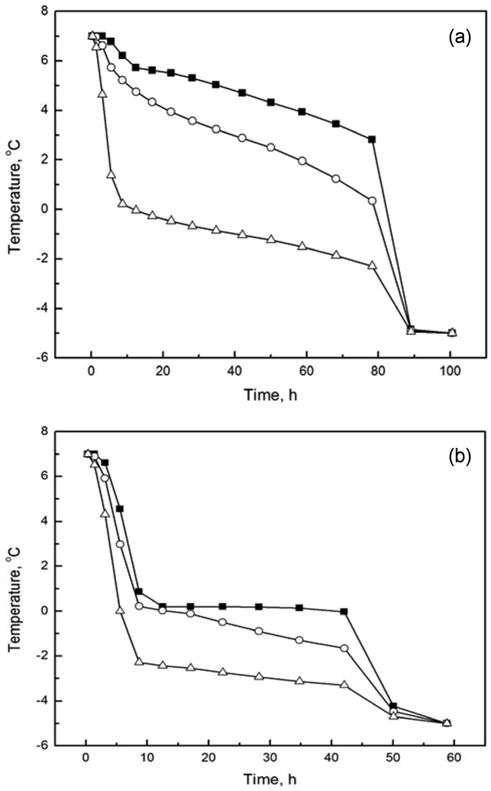
In order to further investigate the temperature change with respect to time, we plotted the temperature history calculated at three representative positions of 20.152, 26.754, and 30.228 cm, which correspond to the inside, PCM, and outside positions, respectively. The simulated data are presented in Figure 5. From Figure 5(a), we observe that the temperature gradually decreases from 7 to 2.85 ℃ at the position of 20.152 cm. It takes 80 h for the temperature to reach 2.85 ℃ starting from 7 ℃, and there is a dramatic drop down to −5 ℃ after 80 h. This result is in good agreement with the temperature change with respect to position in Figure 4(a). Furthermore, the cooling rate at the position of 26.754 cm is slightly faster than that at the position of 20.152 cm, while the cooling rate at the position of 26.754 cm is slower than that at the position of 30.228 cm. This phenomenon can be explained by two factors. The first one is the difference in the distance from the heat sink. Indeed, the positions of 20.152, 26.754, and 30.228 cm are assigned to the inside foam, PCM, and outside foam, respectively. A shorter distance of measurement indicates a correspondingly longer distance from the external heat sink. The second factor is the difference in materials, which results in different thermo-physical properties. For example, from Figure 5(a), we observe that the temperature at the position of 30.228 cm, which corresponds to the outside foam, dramatically reduces to zero within about 10 h, while the temperature at the position of 26.754 cm remains at around 1 ℃ until 80 h. These results indicate that the release of latent heat due to phase change of n-tetradecane effectively aids in resisting heat loss to the outside. Moreover, the results also indicate that the heat transfer resistance of foam is not sufficient for maintaining a constant inside temperature for long periods of time. Unlike the case of n-tetradecane, in the case of water (Figure 5(b)), the temperatures calculated at all three positions quickly drop down to nearly 0 ℃ within about 10 h, and the inside temperature remains at around 0 ℃ until 45 h.
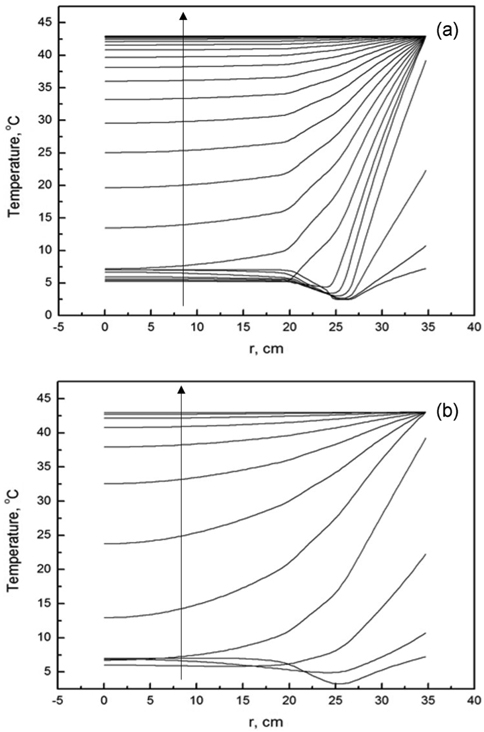
It is known that the highest temperature inside of the insulated package should be less than +30 ℃ for 48 h under outside temperature conditions of +43 ℃ [1]. In order to investigate the change in inside temperature with respect to time during the heating process, the initial conditions were set as follows:
T0 = 7 ℃ and Tout = 43 ℃ Tmb = 2.48 ℃ and Tmf = 5.64 ℃
where the initial inside and outside temperatures were 7 and 43 ℃, respectively. The phase change occurs from 2.48 ℃ to 5.64 ℃ for n-tetradecane and from − 0.2 ℃ to 0.2 ℃ for water. We note that the solid temperature of n-tetradecane is assumed to be 1 ℃, while the ice temperature is assumed to be −1 ℃. The simulation results are shown in Figures 6 and 7. Figure 6 shows the temperature change with respect to the positions in the box calculated at various times during the heating process. Each time interval corresponds to a different temperature profile. From Figure 6, we observe that the heating profile is quite different from the cooling profile (Figure 4) for both n-tetradecane and water. Further, we observe that the temperature profile from 0 to 20.5 cm is almost constant, particularly for the case of n-tetradecane, because the packaging area is filled with inert air, which has a low thermal diffusivity. However, the temperature significantly changes with respect to positions in the range from 20.5 to 34.7 cm. From Figure 6(a), we observe that the temperature of n-tetradecane gradually increases from 2.84 to ~ 30 ℃ after 50.09 h, thus indicating that n-tetradecane is an appropriate insulation candidate during the heating process for the packaging and shipping of vaccines. Figure 6(a) clearly reveals that the n-tetradecane located at the position of 26 cm acts as an excellent thermal resistance, unlike the case of water (Figure 6(b)). On the other hand, in the case of water, the temperature reaches 30 ℃ after only 12.52 h. This result indicates that water is not a suitable insulation candidate during the heating process as a PCM in the packaging and shipping of vaccines.
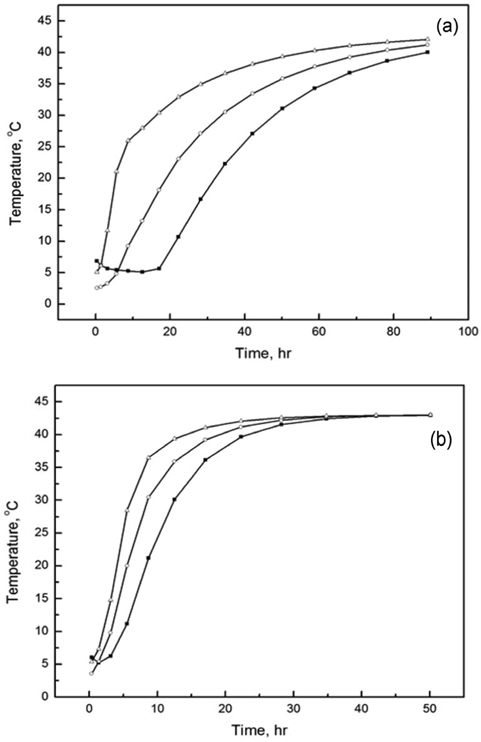
To further clarify the role of the PCM during heating process, we simulated the temperature history of the system at three different positions of 20.15, 26.75, and 30.23 cm. The simulated data are presented in Figure 7. From Figure 7(a), we observe that the temperature history at the position of 20.15 cm is stable around 6 ℃ until 20 h. Subsequently, it gradually increases to 30 ℃ until a simulation time of 50 h. Figure 7(a) also reveals that the time for maintaining constant temperature is shortened with increase in the position from 26.75 to 30.23 cm while the heating rate increases. The difference in heat resistance due to the difference in materials can be used to explain this phenomenon, as mentioned previously. The temperature history for water shows a trend similar to that of n-tetradecane, as can be observed from Figure 7(b). However, the longest time interval required for reaching 30 ℃ is only about 12 h. This interval is shorter than that for n-tetradecane and the WHO index. Thus, water is not a suitable candidate during the heating process as a PCM in the packaging and shipping of vaccines.
It is well known that the heat transfer rate of n-tetradecane is less than that of water. Furthermore, the thermal diffusivity, α, can be calculated by using the following expression:

where
n this study, we successfully accomplished the modeling and simulation of heat transfer in a container used for the packaging and shipping of vaccines, with n-tetradecane being utilized as a PCM. Through applying a simple one-dimensional model, which is a spherical model with a radius equivalent to the rectangular geometry of the container, we developed a basic algorithm for simulating complex heat transfer process through multi-slabs combined with different materials including PCM. The simulation results showed that n-tetradecane, having a low thermal diffusivity and a proper phase transition temperature, can be suitably used for packaging and shipping of vaccines during both the heating and cooling processes. The simulation using the algorithm developed can be a rapid and economic tool for screening appropriate PCMs used as insulation materials with low thermal diffusivity and suitable phase transition temperature in logistics applications.