강우유출수 오염물 제거를 위한 침투시설에서 모래필터가 널리 적용된다. 공극폐색, 즉 필터 여재에 부유물이 침전되면 침투능이 저하되어 침투시설의 기능과 수명이 단축된다. 침투시설의 효과적인 설계 및 유지관리를 위해 모래필터 내의 물리적, 화학적, 생물학적 폐색 특성을 알아야 한다. 이 논문에서는 여재 깊이 변화에 따른 모래필터의 물리적 폐색 특성변화를 검토하였다. 연직방향, 변수위 침투조건에서 시행한 실험실 컬럼 침투실험으로부터 이들 특성변화를 관찰하였다. 실험결과, 폐색현상의 결과로서 필터의 여재 깊이가 증가할수록 부유물 제거효율이 증가하지만, 필터의 성능유지 기간은 감소하는 현상을 보였다. 모든 여재 깊이 조건에서 여재 깊이의 상부 15%에서 100~250 μm의 부유물이 침전되면서 폐색현상이 발현하는 조기폐색이 발생했다. 결과에 근거하여 침투시설의 첫번째 유지관리 시침투능 확보를 위해 여재깊이의 상부 15%를 긁어내는 방법을 제안할 수 있었다.
Stormwater infiltration systems were often employed to treat and manage the increased volumes of urban runoff prior to its discharge into the bodies of water or infiltration into the groundwater systems (Yong et al., 2013). It also assists on climate change adaptation by providing a source for non-potable water supplies. These systems were proven to be effective in removing various stormwater pollutants; however, they usually experience clogging which reduces its designed lifespan and function. Clogging, a significant and highly unfavorable problem that occurs in stormwater filters, was defined as the reduction in infiltration rate, also termed as hydraulic conductivity or permeability, of a porous media that leads to an increased overflows and long periods of ponding, resulting in a range of issues pertaining to public safety (e.g. mosquito breeding or foul odor), flooding, aesthetics and damage or failure filter system (Larmet et al., 2007, Le Coustumer et al., 2009). Several studies were available which are related to clogging. Blazejewski and Murat-Blazejewska (1997) stated that the accumulation of wastewater solids and vegetation debris, the growth of biofilm onto the granular medium, roots and rhizomes, and the deposition of chemical precipitates are the main factors of clogging; Langergraber et al. (2003) and Winter and Goetz (2003) identified that the suspended solid (SS) loading plays a more vital role in clogging as compared to the growth of biomass which only has a minor effect; Knowles et al. (2011) assumed that clogging in a horizontal subsurface flow wetlands are generally caused by physical and biological clogging by which the influence of clogging by chemical adsorption and precipitation can be neglected. In general, the main and common factor for clogging was attributed to the suspended particles or sediments that were carried by stormwater runoff which blocks the small pores of a filter media. It was clear that the active pore volume and the clogging process of a filter media were greatly influenced by its characteristics and by the influent SS loading.
It was well known that in practice, the hydraulic performance and life span of a porous filter media over time is dependent on filter bed designs specifically to the shape and size of filter media and with the suspended particles present in the influent (Kandra, Callaghan et al., 2014; Kandra, Deletic et al., 2014; Kandra, McCarthy et al., 2014; Knowles et al., 2011); the depth and arrangement of filter media (Kandra et al., 2012); and also to the characteristic and rate of inflows (Mercado et al., 2015; Siriwardene et al., 2007). In Kongju National University, South Korea, the constructed LID facilities were designed to have a total depth that ranges from 0.8-1.7 m, by which was in accordance with the standard LID design in USA that includes and implements a designed facility depth ranging from 0.4-1.5 m (Fassman et al., 2013). Likewise, different types of filter media materials were now available and used for the stormwater treatment. Sand filter, which was the typical and most common type of filter, was used primarily due to its low-cost, abundance, and the ability to achieve high removal rates of suspended solids of stormwater runoff. It was also intended primarily for infiltration practices. In South Korea, natural type of sand filters are widely used and generally incorporated and designed with other stormwater management facilities such as infiltration trench and bioretention in order to act as a one set of LID structure that treat and store urban stormwater runoff (MOE, 2014). Current clogging studies in stormwater filters have unfortunately been limited to fine filter media (Hatt et al., 2008) or very coarse media (Hatt et al., 2007; Siriwardene et al., 2007), and were performed on case to case basis with the concept of a black box model.
This study was aimed to give a better understanding of the effect of filter media depth (575 mm and 400 mm) on the rate and nature of clogging of a stormwater sand filter system under continuous vertical flow condition through laboratory column experiments. Impact of clogging on the pollutant removal, sediment accumulation along the filter layer, and the development of pressure along the depth of the filter media were identified.
In any infiltration facility, it was difficult to monitor the actual clogging behavior happening in the field due to several uncontrollable factors such as hydraulic loading rate, consistency of inflows contaminant concentration, and filter media characteristics. Due to these difficulties, improvised laboratory testing methods with specific boundary conditions were used in order to better understand the clogging behavior of a stormwater filter.
2.1. Experimental Set-up and Procedure
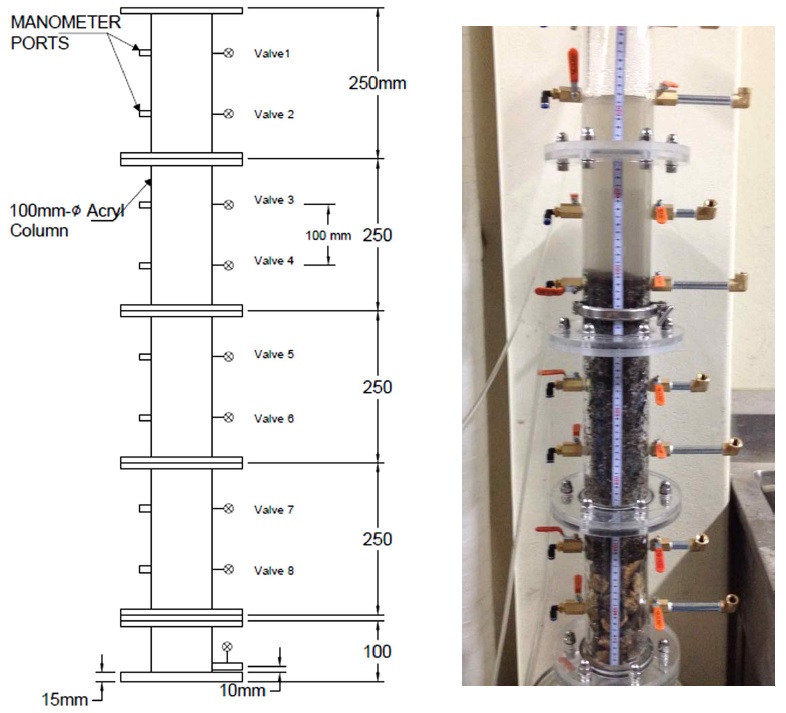
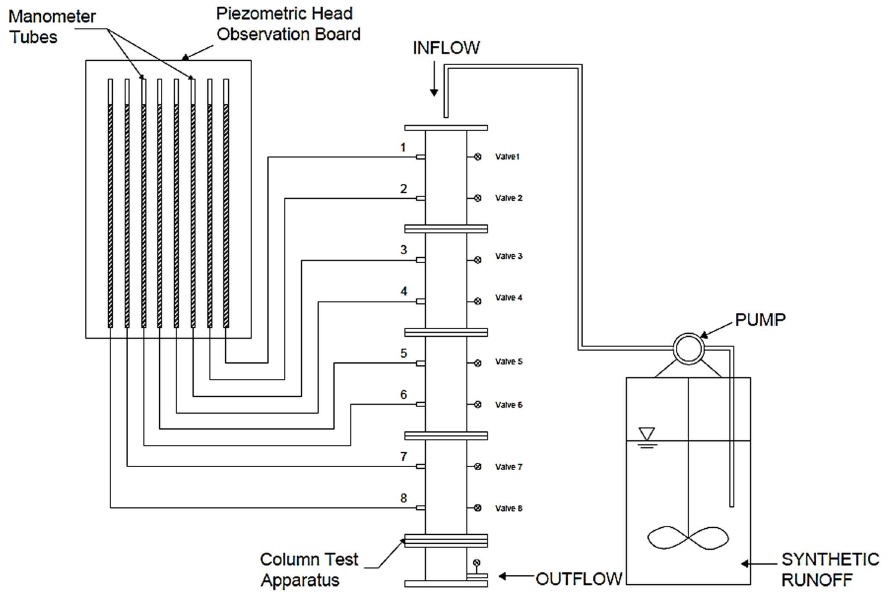
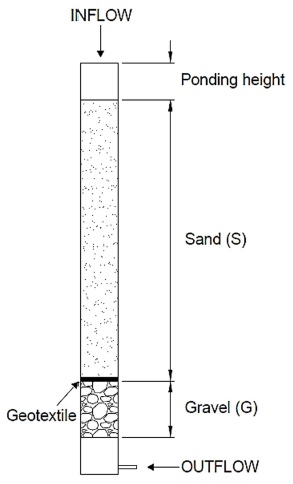
An improvised 1.1 m-high laboratory column apparatus having a diameter of 100mm, as shown in Figure 1, was used to observe the clogging formation in a sand filter column. The sand filter column was prepared under unsaturated state condition in order to mimic the actual field phenomena before the introduction of rainfall precipitation. At the start of the clogging experiments, the filter column was dosed with 8 m and 11.5 m of tap water (45-50 pore volume of the filter media), for filter media depth of 575 and 400 mm respectively, to ensure that the media was free of intrinsic dust prior to the introduction of artificial stormwater runoff. Afterwards, synthetic runoff was introduced into the filter column in a controlled continuous flow rate with the use of a pump. Synthetic stormwater runoff having the target Total Suspended Solids (TSS) concentration was prepared and stored in a tank with stirrer. Upon the introduction of influent into the soil column, hydraulic heads were monitored with the use of the manometer tubes attached on the valves that were attached at the side of the column apparatus. Tape measure was also placed along the height of the column to observe the movement of water along the filter media and ponding height section. Inflow and outflow water samples were collected at designated time intervals until clogging occurs. The schematic diagram of the whole experimental setup was shown in Figure 2.
2.2. Hydraulic Loading Rate and Influent Characteristics
Previous clogging studies (Hatt et al., 2007; Kandra, Callaghan et al., 2014; Kandra, Deletic et al., 2014; Kandra, McCarthy et al., 2014; Siriwardene et al., 2007) have performed clogging experiments by compressing the months of operational life of the systems to weeks of experimentation. Continuous dosing event without drying regime was adopted in this study until clogging occurs due to experimental time constraints and logistical reasons. The hydraulic loading rate used was based on four factors: the recorded rainfall intensities in Korea, the estimated amount of stormwater runoff captured by the stormwater treatment facility, the theoretical catchment area and the actual- laboratory scaling factor. Maniquiz et al. (2010) stated that the average rainfall intensity in Korea was 6 mm/hr. Moreover, an urban road catchment area of 400 m2 was selected as the theoretical catchment area wherein it was assumed that the equivalent filtration area of the laboratory column setup was about 1/100 of the actual treatment facility and was capable of capturing 90% of the stormwater runoff. An estimated runoff discharge amount of 6 ml/sec. for 6mm/hr rainfall intensity was obtained and implemented based on the mentioned factors.
The focus of this study was limited only to total suspended solids (TSS) in stormwater runoff. As studies suggest, majority of stormwater pollutants, especially heavy metals, were attached to TSS. Synthetic runoff was used as influent in order to ensure the consistency of concentration of suspended solids. It was prepared in a tank with stirrer using tap water and sediments collected in highways with target TSS concentration value of 150 mg/L that passed thru No.60 sieve (250 μm) sieve by which these values are nearly similar to the TSS concentration and particle size used by Duncan (1999), Siriwardene et al. (2007) and Hatt et al. (2007). Furthermore, 0.2-2 mg/L of Sodium Hypochlorite (NaOCl) solution was added to the synthetic runoff. Sodium hypochlorite was generally used for water treatment because it was believed that the addition of this solution can help on disinfecting the suspended solids from any biological matter present and it also helps on inhibiting any biological activity that may happen within the filter system (Morganti, 2002)
2.3. Filter Media Arrangement and Characteristics
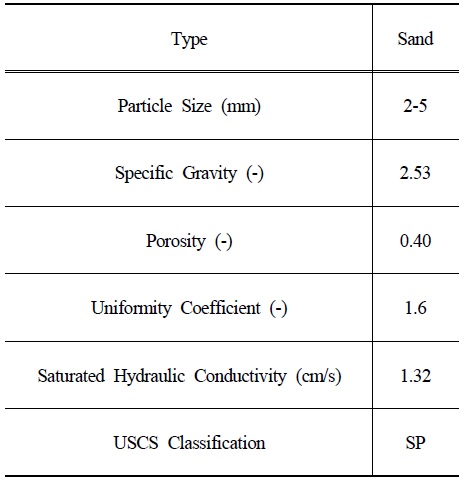
A layer of sand filter column was prepared in an improvised 1.1m-high laboratory column apparatus in order to observe the clogging formation. A total of two non-vegetated column experiments were performed having filter media made up of a layer of sand and gravel with a certain depth denoted by S and G respectively as shown in Figure 3. The filter facility used, having a total depth of 1m, was based on the average LID facility depth implemented in USA. The sand filter bed used for the two experiments has different heights of 575 and 400 mm. The choice of 575 mm filter bed depth was based on the facility total depth subtracted by the typical height for gravel drainage layer and ponding height. The depth of gravel layer representing the drainage and retention layer should have a standard depth greater than 125 mm (Huisman and Wood, 1974), wherein, a fixed 175 mm depth was used in this study. Moreover, for any stormwater filter facility, the standard allowable ponding height used usually ranged from 150-300 mm to allow proper vegetative diversity. Ponding height of 250 and 425 mm was respectively used for 575 and 400 mm sand filter depth. A filter media depth of 400 mm was selected for the other column experiment for the purpose of evaluating the effects of filter media depth on the development of clogging. The selection of 2-5 mm sand particle size was within the 0.5 to 10 mm range by which results from previous study of Kandra, Deletic et al. (2014) showed that media size less than 0.5 mm generated a low permeable media whereas a filter facilities having media particle sizes greater than 10 mm can have a low treatment efficiency. Geotextile was placed at the interface of the sand and gravel layer in order to avoid the migration of sand particles to the drainage layer and also to mimic the actual field setup where in a geotextile was generally placed in between soil layers having different properties. Properties of the filter media such as particle size, specific gravity, porosity, uniformity coefficient, and saturated hydraulic conductivity, as shown in Table 1, was determined prior to column testing by performing standard methods for testing of soil. Filter media used was categorized as poorly graded sand “SP” based from Unified Soil Classification Standards (USCS).
[Table 1.] Filter Media Properties

Filter Media Properties
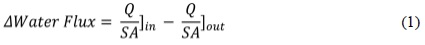
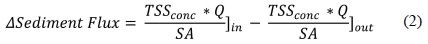
Water flux or the flow rates entering and leaving the system, and the sediment mass flux were measured at the start of simulation and every 15 minutes for the first hour of experimentation and then every 30 minutes for the succeeding hours until the end of test run. Change in Water flux and sediment flux can be calculated by using the following equations:


where ΔWater flux (m3/m2-hr) is the change in flux between the inflow and outflow water, ΔSediment flux (kg/s-m2) is the change in mass flux between the inflow and outflow, Q (m3/hr) is the inflow and outflow discharge, SA (m2) is the surface area of the filter column, TSSconc (mg/L) is the influent or effluent amount of total suspended solids. Careful unit conversion must be observed in utilizing Equations 1 and 2. Water sample collection was done until complete clogging or premature clogging occurs. As described by Mercado et al. (2015), complete clogging is a state where the outflow was reduced to 15-20% of the initial outflow without reaching water overflow, whereas ponding that would later result to overflow without attaining the 80-85% reduction in initial outflow was characterized as premature clogging.
The grab water samples were analyzed for TSS concentration in accordance to standard test methods and Particle Size Distribution (PSD) using Beckman Coulter LS230 Laser Diffraction Particle Size with small volume module plus (Greenberg et al., 1992). Water movement along the filter media and ponding height of the column apparatus as well as the manometer pressure head readings were observed and recorded until clogging state was reached. At the end of each test run, where it was suspected that clogging already occurred, the columns were carefully dismantled. Soil samples were obtained at designated sample depths and were oven dried and sieved in order to determine the amount of accumulated sediments. The sediments retained at different filter media depths were also analyzed for PSD in order to determine the particle size range retained on the specified layer. Moreover, the particle removal efficiency of the filter media was evaluated by comparing the inflow TSS concentration with the TSS in the final outflow water samples.
3.1. Influence of Filter Media Depth on the Rate of Clogging
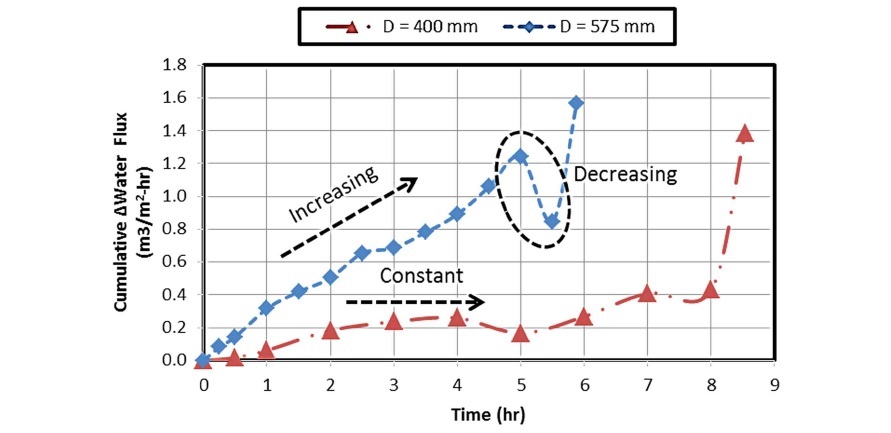
It was observed that premature clogging prevails in all column experiments since ponding and overflow were achieved without attaining the reduction of final outflow to 15-20% of initial outflow. After the occurrence of clogging, the initial outflow for the 400 and 575 mm filter media depth was reduced by 22.73% and 16.50% respectively. As shown in Figure 4, deeper (D = 575 mm) filter column clogs faster and was able to achieve higher cumulative change in water flux even though the shallow depth (D = 400 mm) filter column gave a higher reduction in initial outflow. A steeper cumulative water flux with respect to time, as exhibited by the 575 mm depth column, may specify a higher permeability reduction of the filter media. It was hypothesized that the mobilization of sediments deeper to the filter column was mainly caused by having a higher allowable water pressure built up at the ponding height section. As the water in the allowable ponding height increases, an increase in pressure was also experience in the system which tends to push the smaller sediments further down the column.
The entrapment and entrainment of sediments deeper into the filter column tend to reduce greatly the filter media’s active pore volume and thus affecting its permeability. This scenario was predominant in the shallow filter column by which it exhibited a higher value of initial outflow reduction. On the other hand, deeper column tends to clog faster because there was a shorter depth available for ponding height; therefore, a lesser value of allowable water pressure was experienced by the clogging layer developed within the filter media. This hypothesis agrees with the study of Kandra, Deletic et al. (2014). It can also be seen in Figure 4 that an increasing trend in water flux signifies that a clogging layer was being formed, while the constant or decreasing trend implies that a clogged “thin” layer was breached. Infiltration of the clogged layer due to the applied force of the water build up at the ponding height can somehow increase the lifespan of the system; however, it can promote the transport of the accumulated sediment which can further affect the effluent quality and induce the formation of a deep clogging layer. In addition, a clogged layer was observed to be infiltrated for both filter media depth configuration before reaching the premature clogging state, meaning that the pressure experienced at this time was the limiting resisting capacity of the formed clogged layer before reaching the full state of clogging.
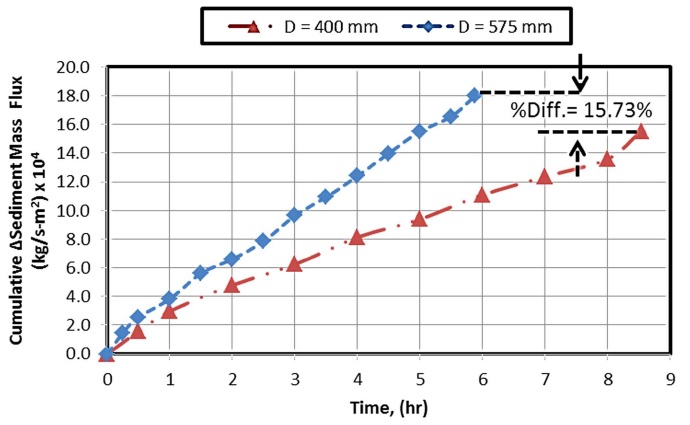
As for the change in sediment mass flux, an increasing trend for both depth configurations was evident, implying that the sediment content present in the stormwater effluent was reduced over time. Figure 5 shows the cumulative change in sediment mass flux of both shallow and deep filter column. The sediment removal for D = 575 mm was 15.73% higher as compared to D = 400 mm column despite having the faster time to clog. This observation agrees with the hypothesis mentioned above, that the water pressure built up tends to push the sediments deeper into the filter column or out of the system. The sediment accumulation for the deeper column noticeably increases until it reaches clogging. The higher removal amount of sediments of the deeper system may also be attributed to the increased contact time between the sediment and filter media that enhances the adsorption/adhesion or interception of particles. Moreover, sediments entrained and entrapped within the filter media may also enhance and assist on further sediment capture that was happening during the entire function of the filter system.
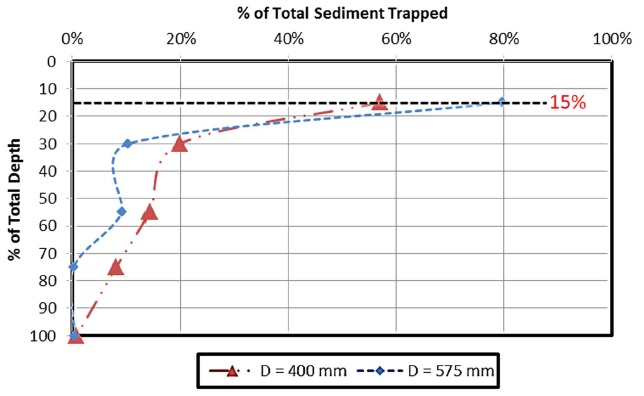
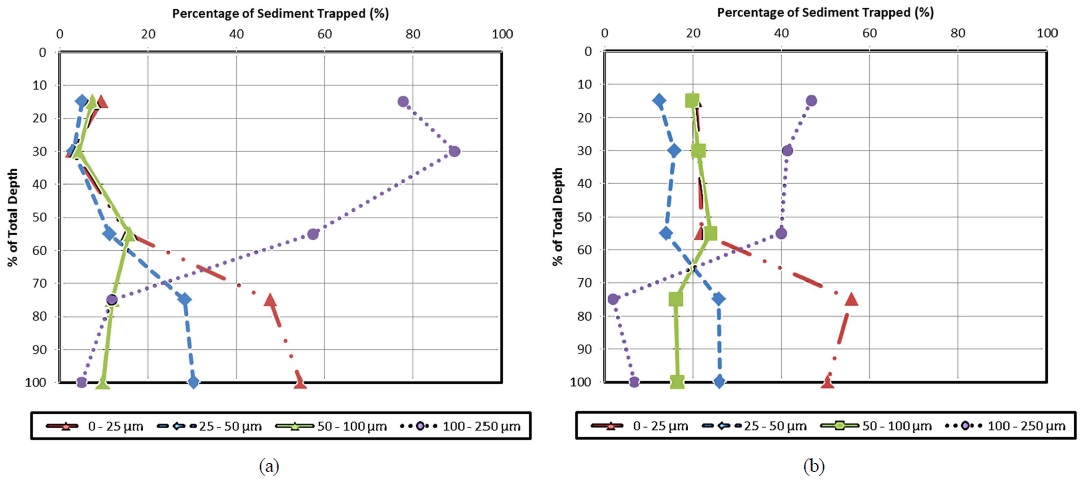
Sediment accumulation of both filter depth configuration was highest at the upper 15% of depth then suddenly decrease as it reaches the bottom as shown in Figure 6. It was found that 79.64% of the total sediment trapped in the 575 mm filter media depth, as compared to only 56.93% for the 400 mm depth, had accumulated at the upper 15% of the filter column. A cake layer was observed to form at the surface of the filter column regardless of media depth. The formation of the cake layer was assumed to be brought by the filter media enhanced sedimentation and filtration. It was observed in Figure 6 that, for a shallow filter media depth, more sediment were mobilized and driven deeper into the filter column. Moreover, the percentage of sediment trapped per gram of filter media with respect to depth for different sediment particle sizes were presented in Figure 7. The amount of 100-250 μm sediment particle size decreases with filter media depth for both depth configurations; however; for 400 mm depth, the amount retained for this particular sediment size range at the filter column profile was considerably high as compared to the 575 mm depth. It was hypothesized that the chance for particle entrainment of larger sediment size decreases across filter depth, wherein, smaller sediment has the higher chance to go further down the filter column. On contrary, the amount of particle sizes < 50 μm were found to increase with depth. This result agrees with Wang et al. (2012) wherein the accumulation of fine particles (0-38.5 μm particle diameter) increases with depth. It clearly agrees with the previous statement that the pressure increase due to water built up in the allowable ponding height has the ability to push and drive the small sediments particles deeper into the filter column.
3.3. Sediment Removal Efficiency when Clogging Developed
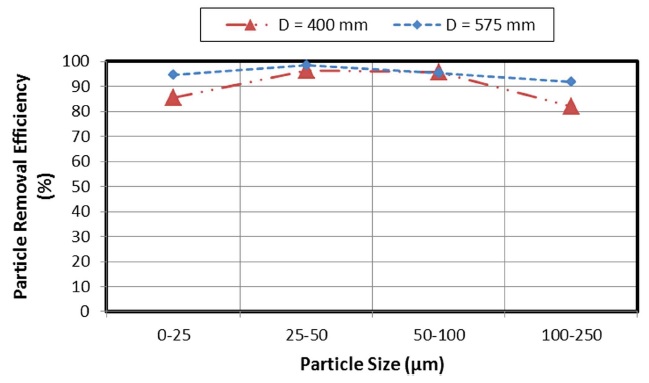
Particle removal efficiency of the filter column was determined by comparing the sediments present in the inflow water with the water sample obtained from the final outflow. Figure 8 shows the particle removal efficiency of different filter media depth configuration for each distinct sediment particle size ranges. Positive removal efficiency of all sediment particle sizes was observed for both 400 and 575 mm filter media depth. It was evident that higher sediment removal efficiency for any sediment particle size range was attained by 575 mm depth due to the longer contact time between the sediment and filter media. The highest particle removal efficiency for both 400 and 575 mm depth was observed for 25-50 μm particle size having a value of 96.45% and 98.58% respectively. Influent water large sediments accumulation at the top of the filter layer together with the effects of van der Waals force may successfully improve the particle capture efficiency of smaller sediment particle size by which 25-50 μm sediment particle size range is the one who benefitted a lot from such behavior. Moreover, a 9.2% difference between the removal efficiency of 575 mm and 400 mm depth for particle size range of 0-25 μm was found, wherein, the lower particle removal efficiency of 400 mm depth for this particular sediment size range may become unfavorable. Roger et al. (1998) stated that the particles < 50 μm has the highest concentration of heavy metals in highways. Vaze and Chiew (2004) suggested that pollutant treatment facilities must have the ability to remove particulates down to 11 μm in order to effectively remove Total Phosphorus (TP) and Total Nitrogen (TN). Similarly, Bian and Zhu (2009) identified that concentration of heavy metals were highest for particle size fraction of 63 μm and also, organic matter and nitrogen content generally increased with decreasing particle sizes in the <500 μm. Overall, results showed that the sediment removal efficiency of both depth configurations for any sediment particle size was high as clogging occurs.
3.4. Pressure Head Development
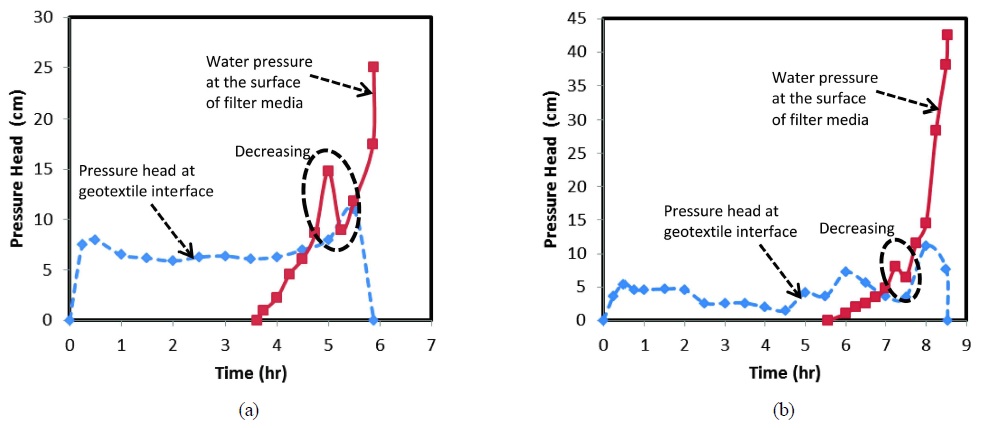
Pressure head readings were only recorded at the sand-gravel interface due to the presence of water built up on this section brought by the geotextile. It indicated that the filter media at the other manometer port location exhibited an unsaturated state soil condition by which correct manometer pressure readings can only be achieved at the condition wherein the soil is saturated. As shown in Figure 9, certain relationship was still found between the water built up in the ponding height and the pressure recorded at the sand-gravel interface. Both filter media depth configuration showed that as the water starts to accumulate at the ponding height section of the filter column, a decrease in pressure was experienced at the geotextile interface, and vice-versa. This scenario implied that for both cases, surface filtration was the main cause of clogging. Fluctuating pressure head measurement at the geotextile interface, as observed in Figure 9(b), indicated that a clogging layer was being formed or infiltrated. This pressure head fluctuation was prevalent on shallow media depth where it may imply that there was a more active particle rearrangement and movement happening within the filter system. Furthermore, a decrease in water head at the surface of filter media was observed for both cases before reaching the premature clogging condition.
Laboratory column experiments can provide insights which can be helpful to better understand how much a filter system would perform over time. This study was executed in order to evaluate the effect of filter media depth in the clogging formation of a stormwater sand filter. The deposition of a blanket or “cake” layer on the top of the substrate was found to be the main reason for the occurrence of premature clogging in all filter media depth configurations. Results showed that filter media depth greatly affects the performance and clogging rate of a nonvegetated sand filter having an average influent flow rate. It was evident that an increase in filter media depth resulted in a high sediment removal performance; however, it leads to a shorter filter lifespan. The improved sediment removal of the deeper systems was the result of smaller allowable ponding height and increased contact time between the sediment and filter media. The allowable ponding height was found to be a critical factor for clogging; for it was the main source of the allowable water pressure build up that mobilizes and drives of the sediments deeper into the column under continuous flow fluctuating head conditions. The clogging layer for both depth configurations were identified to have occurred in the upper 15% of the media depth generally brought by the filtration of 100-250 μm sediment particle sizes. Both filter bed configurations performed well by giving a high positive removal efficiency values in all sediment particle size ranges. This study suggests that scrapping of the first 15% of the filter media for the first set of maintenance can significantly improve the hydraulic function of a clogged stormwater filter system. Moreover, the choice of filter media depth to be used on field applications still depends on the purpose of the facility and on the overall construction and maintenance cost.