검색 전체 메뉴
PDF
맨 위로
OA 학술지
경안천의 하천복원 사업 전?후 저서성 대형무척추동물 군집구조 비교 분석 Comparative Analysis of Benthic Macroinvertebrate Communities Before and After the Restoration Project in the Kyoungan Stream
ABSTRACT
경안천의 하천복원 사업 전?후 저서성 대형무척추동물 군집구조 비교 분석

This study aims to analyze the changes in the benthic macroinvertebrate community before and after a restoration project in a eutrophic stream. Species diversity and species richness increased at the points where the channel changed from standing water to running water. However, species diversity and richness decreased at the points where only riparian restoration was implemented, and the concentration of suspended solids increased, while biochemical oxygen demand and total phosphorus decreased and the concentration of dissolved oxygen increased. In such reaches, functional feeding groups went from collector-filterers to collector-gatherers, and habitat orientation groups changed from clingers to burrowers.

KEYWORD
Benthic macroinvertebrate , Kyoungan Stream , Restoration , Species diversity
  • 1. Introduction

    생태하천에 대한 국민적 관심과 요구가 증대하여 최근 들어 하천복원 사업이 급증하고 있다(Song, 2010). 경안천에서는 2001년 경안천 환경정비사업(호동교~운학동, 3.6 km), 자연형 하천정화사업(삼계교~오운교 하류보, 3.4 km, 2003~2008년), 시민 친수 공간 조성 사업(오포대교~쌍령동, 12.3 km, 2006~2009년), 자연형 하천정화사업(호동교~삼계교, 8.9 km, 2007~2009년), 환경정비 개선사업(남림교~수포교, 4.74 km, 2007~2010년)이 시행되었다. 또한 경안천 중권역 물환경관리계획의 총 예산 2,941억 중 수생태복원 분야의 예산은 1,737억원(59%)에 달한다(HERC, 2008).

    이와 같이 막대한 예산이 투입되고 있음에도 국내에서 하천복원사업 전‧후의 수생태의 변화에 대한 평가사례는 많지 않으며, 관련된 주요 연구사례는 어류를 중심으로 한 창원천 남천의 생태복원 전‧후 생태건강도 비교 평가(Kim et al., 2010)와 인천시 도시복원하천 공촌천의 저서성 대형 무척추동물의 군집 구조에 관한 연구(Song et al., 2014)가 있다.

    저서성 대형무척추동물은 담수생태계에서 가장 다양하고 풍부하며(Ward, 1992; Williams and Feltmate, 1992), 이동성이 적고, 채집이 용이하며, 긴 생활사를 가지고 있고, 인위적 또는 자연적인 환경변화에 민감하기 때문에 장기적인 수질환경 모니터링에 매우 유용하게 이용된다(Doeg and Koehn, 1994; Hynes, 1970; Tiemann et al., 2004). 따라서 하천복원사업 전‧후의 저서성 대형무척추동물 군집을 비교하는 것은 하천복원의 효과를 검증할 수 있는 효과적인 방법이 될 수 있다.

    본 연구는 경안천의 하천복원사업 전‧후의 물리‧화학적 변화와 이에 따른 저서성 대형무척추동물 군집구조의 변화를 분석하여 복원효과를 파악하기 위한 것이다.

    2. Materials and Methods

       2.1. 조사지점 및 조사기간

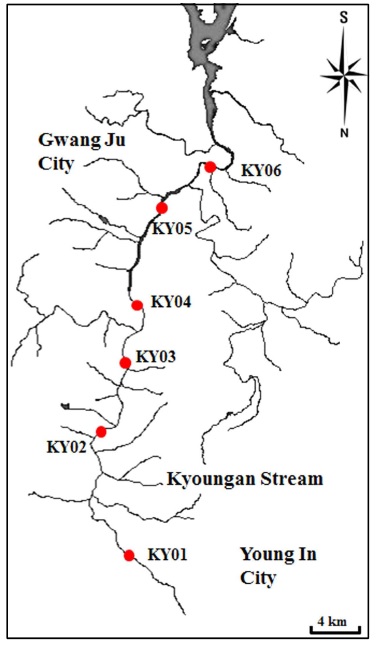
    하천복원사업이 시행되기 전인 2007년에 조사된 경안천 생태조사(GIHE, 2008)의 저서성 대형무척추동물 군집자료와 비교하기 위해, 사업 이후인 2012년 10월부터 2013년 9월까지 동일한 6개 지점에서 계절별 조사(4회)를 실시하였다(Fig. 1).

       2.2. 물리?화학적 평가

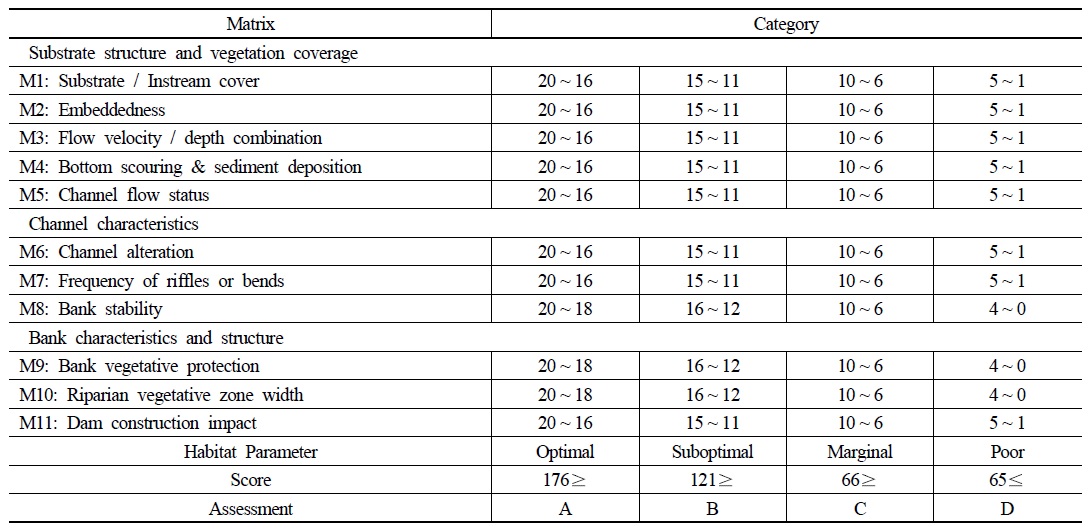
    각 지점의 서식지에 대한 물리적 평가는 경안천 생태조사(GIHE, 2008)에서 적용한 QHEI (Qualitative Habitat Evaluation Index)에 따랐다(Table 1). 이 지수는 Plafkin et al. (1989)이 제시하고 Barbour et al. (1999)가 수정‧변경한 것이다. 또한 QHEI의 평가요소에서 저서성 대형무척추동물에게 직접적인 영향을 미치는 하상구조(M1~M5)와 수로 특성(M6~M8)만을 고려한 지수를 고안하여 QHEI-B (Qualitative Habitat Evaluation Index-Benthic macroinvertebrates)로 명명하고 그 적용성을 검토하였다.

    [Table 1.] Qualitative habitat evaluation index (QHEI) matrix

    label

    Qualitative habitat evaluation index (QHEI) matrix

    경안천 조사지점의 수질자료는 2007~2008년, 2012~2013년 수질측정망자료(MOE, 2007, 2013) 중 해당 조사지점의 연 평균치를 이용하였다. 평가에 이용된 수질 항목은 용존산소(Dissolved oxygen, DO), BOD5 (5-day biochemical oxygen demand), 부유물질(Suspended solids, SS), 총인(Total phosphorus, T-P)이었다.

       2.3. 생물학적 평가

    저서성 대형무척추동물 군집에 대하여 McNaughton (1967)의 우점도지수(Dominance index; DI), Margalef (1958)의 종풍부도지수(Species richness index; R), Shannon and Weaver(1949)의 종다양도지수(Species diversity index; H’), Pielou(1975)의 균등도지수(Evenness index; J)를 산출하였다.

    Ro and Chun (2004)Merritt and Cummins (2008)의 기준에 따라 섭식기능군(Functional feeding groups; FFGs)과 서식기능군(Habitat orientation groups; HOGs)을 분석하였다. 섭식기능군은 걸러먹는 무리(Collector-filterer; CF), 주워먹는 무리(Collector-gatherer; CG), 잡아먹는 무리(Predator; PE), 긁어먹는 무리(Scraper; SC), 썰어먹는 무리(Shredder; SH)로 구분하였으며, 서식기능군은 헤엄치는 무리(Swimmer; SW), 붙는 무리(Clinger; CL), 기는 무리(Sprawler; SP), 굴파는 무리(Burrower; BU)로 구분하였다.

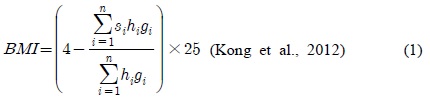
    또한 Kong et al. (2012)의 저서동물지수(Bentic Macroinvertebrate Index; BMI)를 적용하여 생물학적 환경질을 평가하였다(식 (1)).

    image

    여기서, i는 지정된 지표생물종의 일련번호, n은 출현한 지표생물종의 총수, sii 지표생물종의 오탁지수, hii지표생물종의 출현도, gii지표생물종의 지표가중치이다.

       2.4. 통계 분석

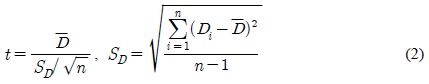
    저서성 대형무척추동물 각 종의 출현유무로 산출된 유사도를 기준으로 하여 비가중치 평균연결법(Jaccard, 1908)으로 군화(Clustering)하였다. 복원사업 전‧후의 차이에 대한 유의성은 물리적(QHEI, QHEI-B), 화학적(BOD5, T-P, SS), 생물학적(R, BMI) 항목에 대해 쌍체 t-검정으로 분석하였다(식 (2)).

    image

    여기서, 는 각 표본요소의 값들의 차이의 평균값, SD는 표본요소들의 차이 값들의 표준편차이다.

    3. Results and Discussion

       3.1. 물리적 서식지 평가

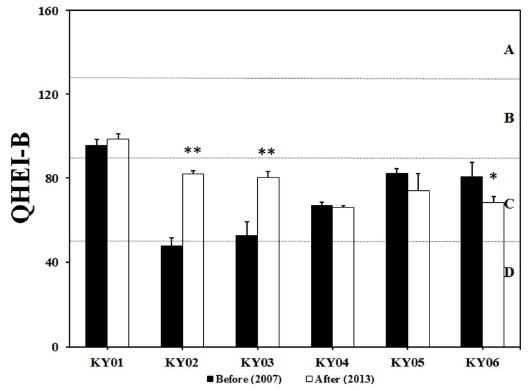
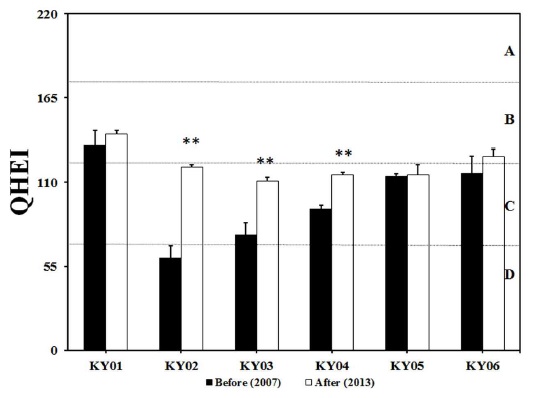
    QHEI에 의한 물리적 서식지 평가결과 복원사업 후에 전체적으로 개선된 결과를 보였으며, 특히 KY02~04 지점은 고도로 유의한 수준의 차이를 보였다(Fig. 2).

    그러나 저서성 대형무척추동물에게 직접적인 영향을 미치는 요소만으로 구성된 지수인 QHEI-B로 평가하였을 때 KY04~06 지점은 서식처의 상태가 악화된 것으로 나타났다(Fig. 3).

    복원사업 이전에 KY02 지점은 세립질의 하상구조를 가진 정체수역이었으나 복원사업으로 보가 철거되어 여울의 빈도 및 하천굴곡도가 증가되었고, 하상구조가 세립질에서 조립질로 변화된 곳이다. KY03 지점은 복원사업으로 하상기질이 모래와 잔자갈에서 호박돌과 자갈로 변화된 곳이다.

    하천의 보는 유속과 퇴적물의 조성에 영향을 미치는 것으로 알려져 있으며(Doyle et al., 2002; Magilligan and Nislow, 2001), 일반적으로 서식처가 단순한 정수역에서는 깔따구류와 같은 소수의 분류군만이 분포하므로 유수역에 비하여 종 다양성이 낮다(Brown and Brussock, 1991; Ward, 1992; Williams and Feltmate, 1992).

    KY04~06의 구간은 하도에 대한 정비 없이 주로 경관중심으로 수변복원이 이루어진 곳이다. 이 구간에서는 수변의 평가요소를 고려하는 QHEI의 값이 증가했지만 하상과 수로의 평가요소만 고려하는 QHEI-B의 값은 감소하였다.

    KY04 지점은 복원사업 전‧후 모두 하류에 있는 보의 영향으로 세립질의 하상을 가진 정체수역이었다. KY05 지점의 하상구조는 복원사업 전과 큰 차이가 없었으나 사업 후 여울부가 감소하였으며, KY06 지점은 사업 후 하상기질이 세립화되었다.

       3.2. 수질 평가

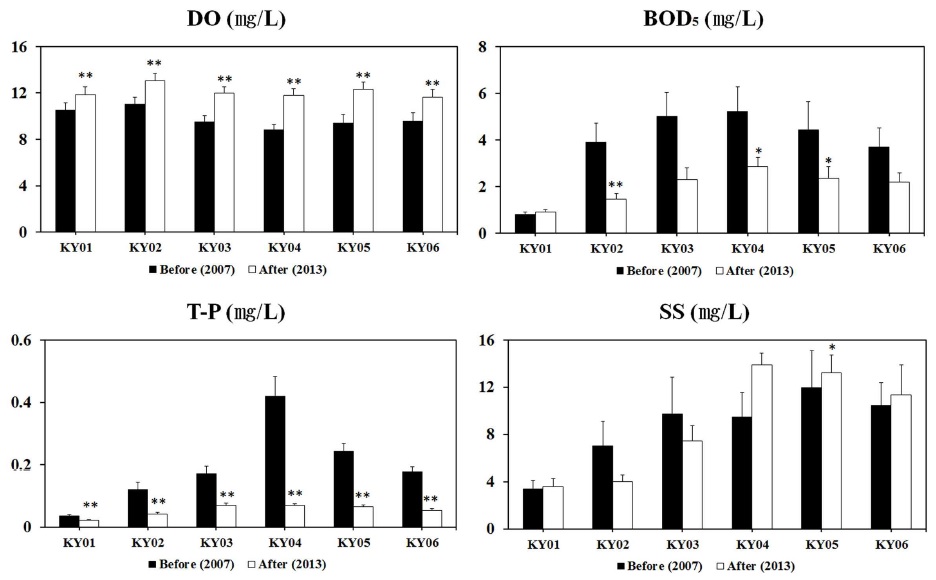
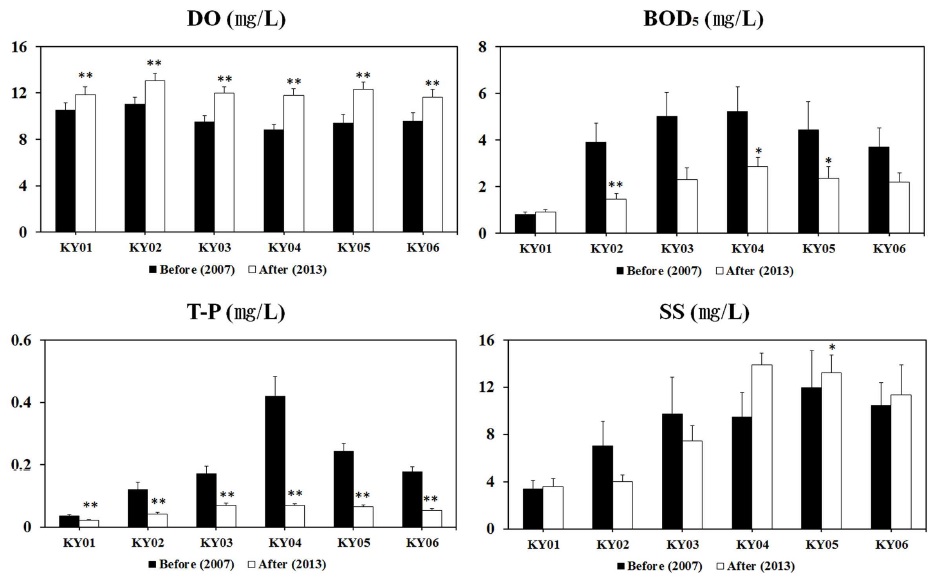
    경안천 유역에서는 팔당 상수원 수질보호, 유지용수 공급, 시민 생활환경 개선을 목적으로 2009년까지 하수처리장 3개소 신설 및 5개소가 증설되었다. 또한 경안천 하수처리시설은 총 용량 129,950 m3/일 규모로 가동 중에 있으며, 기존 처리시설의 개선을 위해 광주, 오포, 매산, 삼성하수처리장 등에 고도처리시설 공사가 이루어졌다(HERC, 2008). 이러한 일련의 수질개선사업에 따라 거의 모든 조사지점에서 BOD5 농도가 감소하였고 이에 따라 용존산소의 농도는 증가하였으며 특히 총인 농도는 큰 폭으로 감소하였다(Fig. 4). 총인 농도의 급감은 하수처리장의 총인 방류수 기준의 강화와 그에 따른 화학적 인 처리의 효과로 보인다.

    이에 반해 부유물질 농도는 하류구간(KY04~06)에서 사업 후에 오히려 증가하였다. 이는 Song (2010)의 경기도 생태하천복원 실태조사 연구에서 복원사업 후 다른 수질항목과 달리 부유물질의 농도는 개선되지 않았음을 보고한 사례와 같다. 하천의 부유물질 농도는 유역의 인위적인 토지이용과 관련이 크고 특히 비점오염원에 의한 영향을 많이 받는다. 부유물질은 저서성 대형무척추동물의 기능군을 변화시키고 다양성을 감소시키는 가장 큰 요인이기 때문에 비점오염원에 대한 관리를 더욱 강화할 필요가 있다.

       3.3. 출현종수의 변화

    복원사업 전 KY02~KY05 조사지점에서는 대체로 환경변화에 대하여 내성범위가 넓은 꼬마하루살이과(Baetidae)와 깔따구과(Chironomidae)가 출현종수의 대부분을 차지하였다(GIHE, 2008).

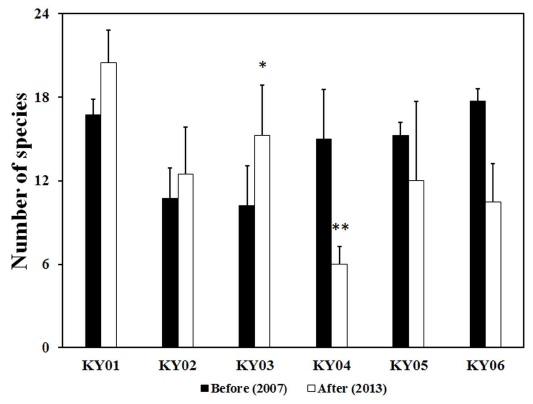
    복원사업 이후 KY01~03 구간은 수질개선과 함께 하도복원이 진행되어 저서성 대형무척추동물이 서식하는 미소서식처가 다양화되어 출현종수가 증가하였는데(Fig. 5), 이는 다른 하천에 대한 Song et al. (2014)의 연구에서 나타난 결과와 같다.

    이와 반면 KY04~06 구간은 전반적인 수질개선에도 불구하고 복원사업 후에 출현종수가 감소하였는데 이는 물리적 서식처의 악화(Fig. 3)와 부유물질 농도의 증가(Fig. 4)와 관계가 있다고 판단된다.

       3.4. 개체수현존량 변화

    복원사업 전에 KY02, KY03 지점에서는 실지렁이(Limnodrilus gotoi)와 깔따구류(Chironomidae sp.), KY04, KY05, KY06 지점에서는 줄날도래(Hydropsyche kozhantschikovi)가 대량 출현하여 전체적으로 출현개체수가 컸다(Fig. 6).

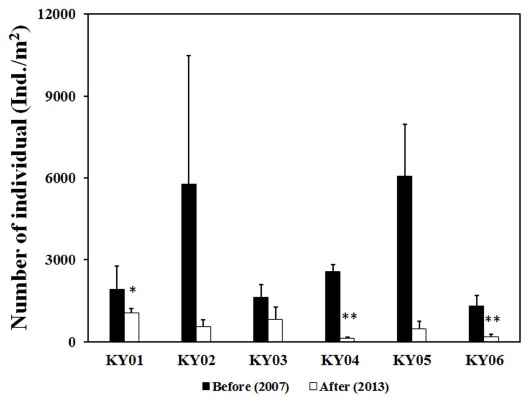
    수질이 개선되고 하도복원으로 여울화된 KY02, KY03 지점에서는 복원사업 후에 실지렁이와 깔따구류의 개체수가 감소하고 총 출현개체수도 작아졌다. 또한 KY04, KY05, KY06 지점에서는 우점종으로 출현하던 줄날도래의 개체수가 감소하며 총 출현개체수도 작아졌다. 하천의 유기물 농도가 상승하면 유기오염에 대한 내성종들이 선택적으로 대량 출현하고 총 출현개체수도 커지는데, 복원사업 후 경안천의 저서성 대형무척추동물의 총 출현개체수의 감소는 유기물 농도의 감소와 관련이 있는 것으로 판단된다.

       3.5. 군집지수의 변화

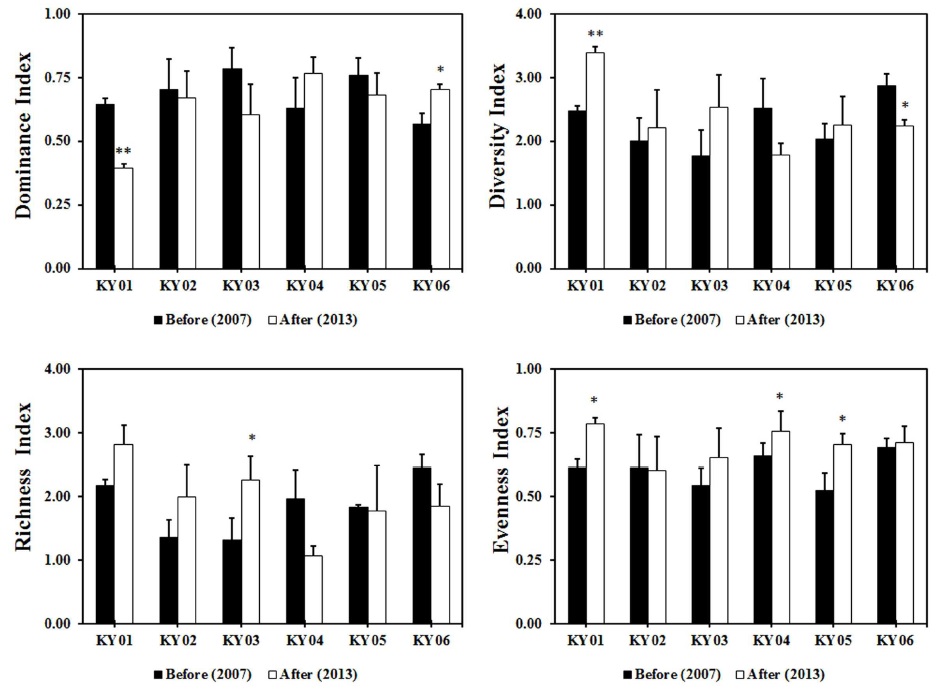
    수질개선과 아울러 하도복원이 이루어져 조립질 하상의 여울이 조성된 KY01, KY02, KY03 지점에서는 다양도와 풍부도가 증가하였고, 우점도는 감소하였다. 이와 반면 KY04, KY06 지점은 우점도가 증가하였고, 다양도와 풍부도는 감소하였다. 전체 조사지점에서 복원사업 전에 우점종이었던 종들의 개체수비가 사업 후 감소하면서 균등도는 중가하는 경향을 보였다(Fig. 7).

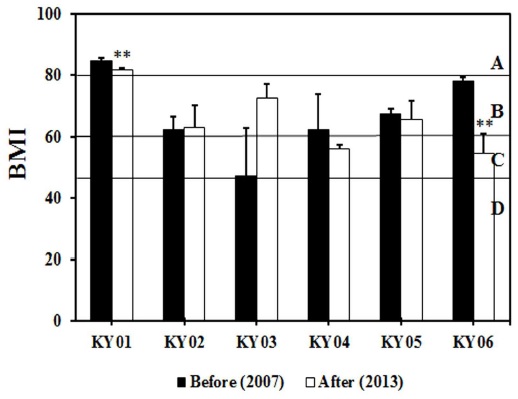
    하도복원이 이루어진 KY02 지점과 KY03 지점을 제외한 모든 지점에서 BMI 값은 작아졌다(Fig. 8). 특히 하류구간에서는 하도 서식질의 악화와 부유물질 농도의 상승에 따라 BMI 값이 감소한 것으로 판단된다.

       3.6. 섭식기능군 및 서식기능군 변화

    하천생태계에서 서식하는 저서성 대형무척추동물의 섭식기능군과 서식기능군의 분포 경향은 주어진 먹이자원과 서식처의 환경요인을 반영한다(Kil et al., 2010). 일반적으로 상류에서는 낙엽 및 식물의 잔사물과 같은 굵은입자유기물(Coarse Particulate Organic Matter: CPOM > 1.0 mm)이 많으며, 이를 이용하는 썰어먹는 무리(SH), 긁어먹는 무리(SC), 주워먹는 무리(CG)의 비율이 높다(Horne and Goldman, 1994). 중·하류에서는 가는입자유기물(Fine Particulate Organic Matter : 0.5 μm < FPOM < 1.0 mm)이 증가하므로(Allan, 1995) 이를 이용하는 걸러먹는 무리(CF), 주워먹는 무리의 비율이 높다.

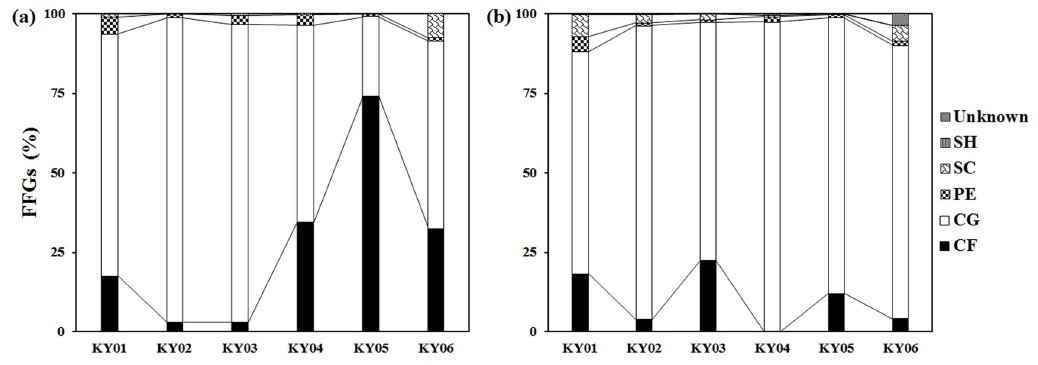
    복원사업 전·후에 경안천에서는 주워먹는 무리(CG)와 걸러먹는 무리(CF)가 80~95%를 차지하였다(Fig. 9).

    복원사업 전에 깔따구류와 실지렁이류 등 주워먹는 무리가 대부분이었던 KY03 지점은 복원사업 후 하도가 여울화되어 줄날도래류와 먹파리류(Simulium sp.) 등 걸러먹는 무리가 증가하였다. 이와 반면 KY04~06 구간은 복원사업 전에 대량 출현하였던 줄날도래류가 감소하고 깔따구류와 실지렁이류 등 주워먹는 무리가 증가하였다. 이 역시 해당 구간에서 물리적 서식처의 악화(Fig. 3)와 부유물질 농도의 증가(Fig. 4)와 관계가 있다고 판단된다.

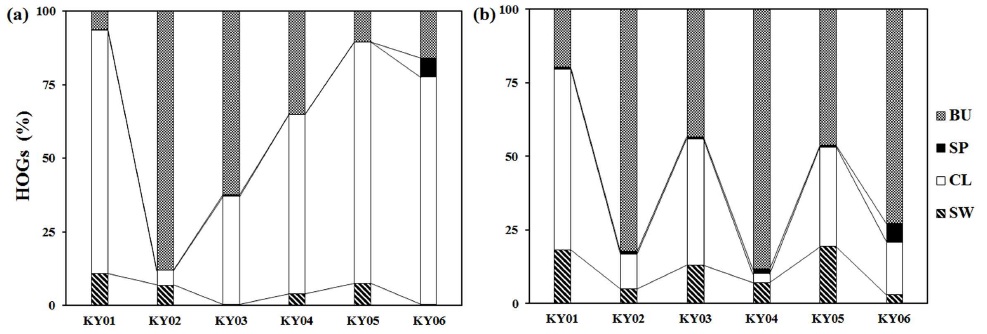
    유수역에서는 미소서식처의 다양성이 상대적으로 높아 헤엄치는 무리(SW), 붙는 무리(CL) 등의 기능군이 다양하게 분포한다(Ward, 1992; Williams and Feltmate, 1992). 복원사업 전에 KY02, KY03 지점은 깔따구류와 실지렁이와 같은 굴파는 무리의 비율이 높았고, KY04~KY06 지점은 고리 형태로 하상에 몸을 고정하여 서식하는 줄날도래류등의 붙는 무리의 비율이 높았다(Fig. 10).

    복원사업 후 KY04~06 구간에서 붙는 무리는 감소하고 굴파는 무리의 비율이 크게 증가하였다. Rabeni et al. (2005)의 연구에서는 하천의 물리적인 교란이 있는 경우 붙는 무리가 민감하게 반응하며, 굴파는 무리는 물리적인 교란에 내성도가 높다고 하였다. 하류구간에서는 하도 서식처의 악화와 부유물질 상승에 따른 침전물의 증가 등의 요인에 의해 굴파는 무리의 비율이 증가한 것으로 판단된다.

       3.7. 군화분석(Clustering analysis)

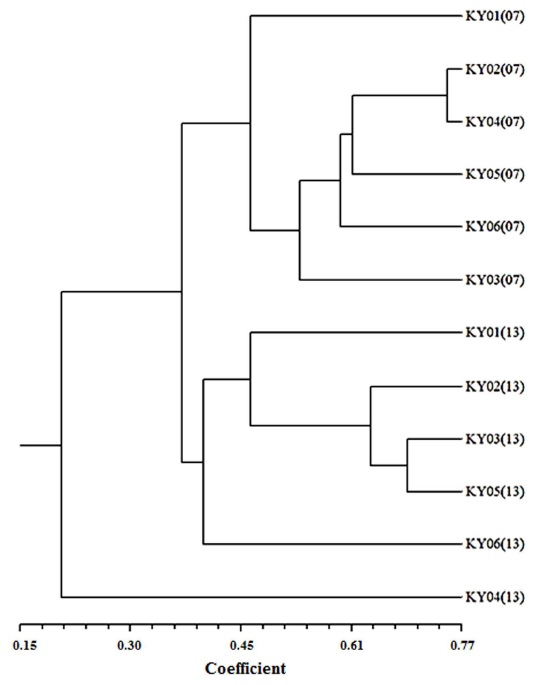
    종의 출현유무를 기준으로 분석된 복원사업 전‧후의 군화 분석 결과는 Fig. 11과 같다.

    복원사업 전인 2007년에는 KY02 지점과 KY04 지점이 유사성이 높았다. 이러한 결과는 복원사업 전의 KY02 지점은 KY04 지점과 유사하게 보로 인해 세립질 하상구조를 가진 정체수역을 이루고 있었기 때문이라고 판단된다. 그 이후 복원사업으로 KY02 지점의 보가 해체되고 유수역으로 변화되면서 유사 환경인 KY03 지점과 군을 이루었다. 반면 KY04 지점은 복원 이후에도 정체수역을 형성하였고 출현종이 적어 다른 조사지점들과 가장 낮은 유사성을 보였다.

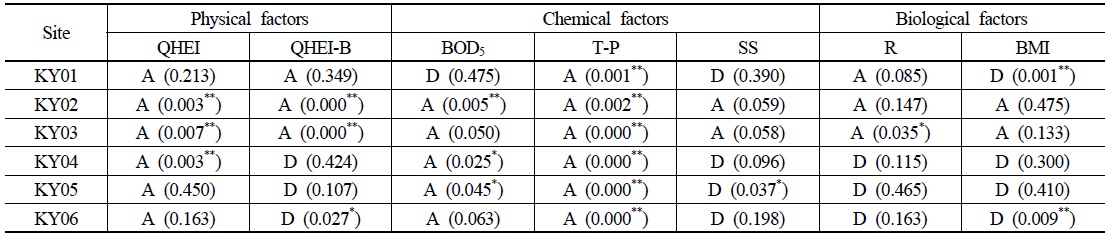
    각 조사지점별 복원사업 전·후의 물리적(QHEI, QHEI-B), 화학적(BOD5, T-P, SS), 생물학적(R, BMI) 평가항목을 쌍체 t-검정한 결과는 Table 2와 같다.

    [Table 2.] Change in physicochemical factors and biological factors (R: Margalef’s species richnes, BMI: Kong et al. (2012)’s benthic macroinvertebrate index) before and after the restoration project evaluated by paired t-test (p-value)

    label

    Change in physicochemical factors and biological factors (R: Margalef’s species richnes, BMI: Kong et al. (2012)’s benthic macroinvertebrate index) before and after the restoration project evaluated by paired t-test (p-value)

    저서성 대형무척추동물 군집의 다양성과 건강성(종풍부도지수와 저서동물지수)은 유기물과 영양물질 농도의 감소와 아울러 하도복원과 부유물질 농도가 감소한 지점에서만 높아짐을 알 수 있다. 즉 유기물과 영양염류(BOD5와 T-P)를 기준으로 한 전반적인 수질개선과 수변경관에 대한 평가요소가 포함된 서식처 평가지수(QHEI) 값이 상승하여도 하도복원과 부유물질에 대한 저감이 이루어지지 않으면 저서성 대형무척추동물 군집에 대한 복원효과는 미미하다고 할 수 있다.

    4. Conclusion

    경기도에 위치한 경안천의 복원사업 전‧후의 물리적, 화학적 변화와 저서성 대형무척추동물 군집의 변화를 비교 분석한 결과 다음과 같은 결론을 얻었다.

참고문헌
  • 1. Allan J. D. (1995) Stream Ecology: Structure and Function of Running Waters google
  • 2. Barbour M. T., Gerritsen J., Snyder B. D., Stribling J. B. (1999) Rapid Bioassessment Protocols for Use in Streams Brates and Fish google
  • 3. Brown A. V., Brussock P. P. (1991) Comparisons of Benthic Invertebrates between Riffles and Pools [Hydrobiologia] Vol.220 P.99-108 google cross ref
  • 4. Doeg T. J., Koehn J. D. (1994) Effects of Draining and Desilting a Small Weir on Downstream Fish and Macroinvertebrates [Regulated Rivers: Research and Management] Vol.9 P.263-277 google cross ref
  • 5. Doyle M. W., Stanley E. H., Harbor J. M. (2002) Geomorphic Analogies for Assessing Probable Channel Response to Dam Removal [Journal of the American Water Resources Association] Vol.38 P.1567-1579 google cross ref
  • 6. (2008) The Survey of Ecology in Kyoungan stream P.262 google
  • 7. (2008) Kyoungan Stream Mid-Watershed Scheme of the Water Environment Management google
  • 8. Horne A. J., Goldman C. R. (1994) Limnology P.375-378 google
  • 9. Hynes H. B. N. (1970) The Ecology of Running Waters google
  • 10. Jaccard P. (1908) Nouvelles Recherches sur la Distribution Florale [Bulletin de la Socie?te? vaudoise des sciences naturellest] Vol.44 P.223 google
  • 11. Kim H. J., Lee S. J., An K. G. (2010) Comparative Analysis of Ecological Health Conditions Before and After Ecological Restoration in Changwon Stream and Nam Stream [Korean Journal of Limnology] Vol.43 P.307-318 google
  • 12. Kil H. K., Kim D. G., Joung S. W., Jin Y. H., Hwang J. M., Bae K. S., Bae Y. J. (2010) Impacts of Impoundments by Low-Head and Large Dams on Benthic Macroinvetebreate Communities in Korean Stream and Rivers [Korean Journal of Limnology] Vol.43 P.190-198 google
  • 13. Kong D. S., Son S. H., Kim J. Y., Won D. H., Kim M. C., Park J. H., Chon T. S., Lee J. E., Park J. H., Kwak I. S., Kim J. S., Ham S. A. (2012) Developement and Application of Korean Benthic Macroinvertebrates Index for Biological Assessment on Stream Environment [Proceedings of the 2012 Spring Conference and Water Environmental Forum of Yeongsan River] P.33-36 google
  • 14. Magilligan F. J., Nislow K. H. (2001) Long-Term Changes in Regional Hydrologic Regime Following Impoundment in a Humid-Climate Watershed [Journal of the American Water Resources Association] Vol.37 P.1551-1569 google cross ref
  • 15. Margalef R. (1958) Information Theory in Ecology [General Systems] Vol.3 P.36-71 google
  • 16. McNaughton S. J. (1967) Relationship among Functional Properties of California Grassland [Nature] Vol.216 P.168-169 google cross ref
  • 17. Merritt R. W., Cummins K. W. (2008) An Introduction to the Aquatic Insects of North America google
  • 18. (2007) Water Environment Information System (WEIS) google
  • 19. (2013) Water Environment Information System (WEIS) google
  • 20. Pennak R. W. (1989) Fresh-water invertebrates of the Unite States google
  • 21. Pielou E. C. (1975) Ecological Diversity P.165 google
  • 22. Plafkin J. L., Barbour M. T., Porter K. D., Gross S. K., Hughes R. M. (1989) Rapid Bioassessment Protocols for Use in Streams and Rivers: Benthic Macroinvertebrates and Fish google
  • 23. Rabeni C. F., Doisy K. E., Zweig L. D. (2005) Stream Invertebrate Community Functional Responses to Deposited Sediment [Aquatic Sciences] Vol.67 P.395-402 google cross ref
  • 24. Ro T. H., Chun D. J. (2004) Funtional Feeding Group Categorization of Korean Immature Aquatic Insects and Community Stability Analysis [Korean Journal of Limnology] Vol.37 P.137-148 google
  • 25. Shannon C. E., Weaver W. (1949) The Mathematical Theory of Communication google
  • 26. Song M. Y. (2010) Survey and Evaluation of Stream Restoration Projects in Gyeonggi Province P.206 google
  • 27. Song Y. J., Ju Y. D., Park B. S., Lee H. J., Chae D. Y., Kim J. M., Bae Y. S. (2014) Study on Community Structure of Benthic Macro-Invertebrates Inhabiting in an Urban Restoration Stream, Gongchon-cheon, in Incheon City [Journal of Wetlands Research] Vol.16 P.371-378 google cross ref
  • 28. Tiemann J. S., Gillette D. P., Wildhaber M. L., Edds D. R. (2004) Effects of Lowhead Dams on Riffle-Dwelling Fishes and Macroinvertebrates in a Midwestern River [Transaction of the American Fisheries Society] Vol.133 P.705-717 google cross ref
  • 29. Ward J. V. (1992) Aquatic Insect Ecology google
  • 30. Williams D. D., Feltmate B. W. (1992) Aquatic Insects google
OAK XML 통계
이미지 / 테이블
  • [ Fig. 1. ]  Location of the survey sites (KY01 : Gileopgyo, KY02 : Yurimgyo, KY03 : Samgyegyo, KY04 : Wangsangyo, KY05 : Gyeongangyo, KY06 : Jiwolgyo).
    Location of the survey sites (KY01 : Gileopgyo, KY02 : Yurimgyo, KY03 : Samgyegyo, KY04 : Wangsangyo, KY05 : Gyeongangyo, KY06 : Jiwolgyo).
  • [ Table 1. ]  Qualitative habitat evaluation index (QHEI) matrix
    Qualitative habitat evaluation index (QHEI) matrix
  • [ ] 
  • [ ] 
  • [ Fig. 2. ]  Change in qualitative habitat evaluation index (QHEI). Error bar indicates standard error (*p<0.05, **p<0.01).
    Change in qualitative habitat evaluation index (QHEI). Error bar indicates standard error (*p<0.05, **p<0.01).
  • [ Fig. 3. ]  Change in qualitative habitat evaluation index-benthic macroinvertebrates (QHEI-B). Error bar indicates standard error (*p<0.05, **p<0.01).
    Change in qualitative habitat evaluation index-benthic macroinvertebrates (QHEI-B). Error bar indicates standard error (*p<0.05, **p<0.01).
  • [ Fig. 4. ]  Annual average water quality. Error bar indicate standard error (*p<0.05, **p<0.01).
    Annual average water quality. Error bar indicate standard error (*p<0.05, **p<0.01).
  • [ Fig. 5. ]  Number of species of benthic macroinvertebrates before and after the restoration project. Error bar indicate standard error (*p<0.05, **p<0.01).
    Number of species of benthic macroinvertebrates before and after the restoration project. Error bar indicate standard error (*p<0.05, **p<0.01).
  • [ Fig. 6. ]  Abundance of benthic macroinvertebrates before and after the restoration project. Error bar indicates standard error (*p<0.05, **p<0.01).
    Abundance of benthic macroinvertebrates before and after the restoration project. Error bar indicates standard error (*p<0.05, **p<0.01).
  • [ Fig. 7. ]  Change in the biotic indices of benthic macroinvertebrates before and after the restoration project. Error bar indicates standard error (*p<0.05, **p<0.01).
    Change in the biotic indices of benthic macroinvertebrates before and after the restoration project. Error bar indicates standard error (*p<0.05, **p<0.01).
  • [ Fig. 8. ]  Change in benthic macroinvertebrate index (BMI) before and after the restoration project. Error bar indicate standard error (*p<0.05, **p<0.01).
    Change in benthic macroinvertebrate index (BMI) before and after the restoration project. Error bar indicate standard error (*p<0.05, **p<0.01).
  • [ Fig. 9. ]  Relative composition of functional feeding groups (FFGs) based on individual abundance. (a) Before restoration, (b) After restoration (Collector-filterers: CF, Collector-gatherers: CG, Predators: PE, Scrapers: SC, Shredders: SH).
    Relative composition of functional feeding groups (FFGs) based on individual abundance. (a) Before restoration, (b) After restoration (Collector-filterers: CF, Collector-gatherers: CG, Predators: PE, Scrapers: SC, Shredders: SH).
  • [ Fig. 10. ]  Relative composition rates of habitat orientation groups (HOGs) based on individual abundance. (a) Before the restoration, (b) After the restoration (Swimmer: SW, Clinger: CL, Sprawler: SP, Burrower: BU).
    Relative composition rates of habitat orientation groups (HOGs) based on individual abundance. (a) Before the restoration, (b) After the restoration (Swimmer: SW, Clinger: CL, Sprawler: SP, Burrower: BU).
  • [ Fig. 11. ]  Clusters in sampling sites based on the presence and absence of species.
    Clusters in sampling sites based on the presence and absence of species.
  • [ Table 2. ]  Change in physicochemical factors and biological factors (R: Margalef’s species richnes, BMI: Kong et al. (2012)’s benthic macroinvertebrate index) before and after the restoration project evaluated by paired t-test (p-value)
    Change in physicochemical factors and biological factors (R: Margalef’s species richnes, BMI: Kong et al. (2012)’s benthic macroinvertebrate index) before and after the restoration project evaluated by paired t-test (p-value)
(우)06579 서울시 서초구 반포대로 201(반포동)
Tel. 02-537-6389 | Fax. 02-590-0571 | 문의 : oak2014@korea.kr
Copyright(c) National Library of Korea. All rights reserved.