In order to develop scientific policies and advance scientific and research programs, it is necessary to have comprehensive and precise information about the potential scientific and technological capabilities of a country. Also, given the fact that science and technology is the driving force of today’s science-based society, evaluation of these capabilities, and qualitative and quantitative analysis of scientific research, is unavoidable in national scientific policies and research management strategies, in order to obtain a comprehensive picture about the scientific structure and growth of the society (Moed, 2005).
By specialization of knowledge and expansion of science over time, various new disciplines have been created in science, engineering, humanities and social sciences, and medical sciences. Given the differences in the nature of these disciplines, it is not possible to achieve desirable policy making in any of the scientific fields without knowing these differences, because the most important goals of scientific policies are evaluation of research needs, evaluative analysis of researcher performance, validation of authors and their works, and development of main strategies for those scientific organizations which need to be mindful of these differences.
Therefore on one hand, due to the different situation of various disciplines, non-standard comparison between disciplines is not advised and on the other hand, due to the necessity of policy making and planning for all active disciplines in an academic or research institution, one needs to compare various disciplines. Therefore an operational and standardized method is needed for correct comparison between various disciplines.
As a result, it is necessary to develop tools and methods that provide a precise evaluation of a country’s scientific situation by considering all different factors. In this regard bibliometrics and scientometrics fields have developed and expanded their theories, tools, and indicators in order to compare the scientific performance of different disciplines based on standardized and normalized indicators.
Therefore the goal of the current study is to investigate the value of all scientific productions in various scientific disciplines while comparing these values in different fields and data formats. In order to meet the study goal, it was conducted around three questions: 1. Which kind of scientific product is common in any of the studied areas? 2. How much is the value of each scientific production in each subject area compared to any scientific production in other subject areas? 3. How much is the equivalent amount of a specific type of scientific production in an area in relation to other types in another area?
By using scientometrics indicators some researchers have attempted to evaluate the research performance of various fields or disciplines.
Davarpanah’s (2010) study investigated various field-base indicators and suggested that a scientific power index which normalizes publications and citations and simultaneously evaluates quality and quantity of scientific works is the best among all available indicators.
Rezaie, in a research study which used survey methods, showed that for researchers in the field of humanities indicators related to books are the most important, while researchers in the fields of natural and medical sciences place greater importance on indicators related to published articles, and those in the field of engineering sciences development place the most emphasis on indicators related to patents and research projects as the most suitable indicators for evaluation of different researchers (Rezaie 2012; Rezaie & Noroozi Chakoli, 2014). Waltman et al. (2011) in their article offer some criticism toward the current Crown indicator (CPP/FCSm) used for normalization of citations in the Science and Technology Center of Leiden University of Netherlands, and then propose a Mean Normalized Citation Score (MNCS) that can be used as a replacement for Crown indicator.
Also in another study by Waltman et al. (2010), two formulations were used in order to analyze citation information in 8 subject categories in the Netherlands in 1999, comparing the results among 4 levels of research groups, research institutions, country level, and journal level. Based on their results, at higher levels such as research institutions or country level the difference between two indicators is negligible, while in lower levels such as research groups or journal level the difference between two indicators becomes apparent.
Waltman and his coworkers in the Science and Technology Center of Leiden University, as well as in other research, suggest some solutions such as field-base normalized indicators, and according to its deficiencies or different situations, offer some editions on these indicators which can measure and compare scientific disciplines fairly (Waltman et al., 2013; 2015).
Torres-Salinas et al. (2011) in their article present a bi-dimensional indicator as a methodology for classification of institute-discipline with regards to scientific productions and quality of productions. This index provides a comprehensive and goal oriented method for comparing the research output of different institutes in a certain discipline with the help of journal citations. This study also used this index for classification of leading Spanish universities in the fields of chemistry and computer science between the years 2000 and 2009.
Dorta-González et al. (2014) in their research suggest the citation potential mesurement in different fields according to the number of scientific productions, citations, and references in four disciplines. This result can be used in the selection and promotion of interdisciplinary research processes.
Chen et al. (2015), in regard to properties of humanities and social sciences showed the result that existing indicators are insufficient for evaluation of research performance in fields according to databases. So, using altmetrics was suggested to keep in account all formal and informal communication channels in these sciences.
Based on previous studies, applied indicators are only useful for comparing the disciplines within a field, and in other words, normalization methods have been applied uniformly for all scientific production formats. Also, weights of different formats in different disciplines have not been compared with each other.
This applied study is a scientometrics study which was carried out in 2013 and uses documentary, evaluative, and survey techniques. The study population (424 individuals) are Iranian researchers that have been introduced as top researchers, scientists, and scientific and research managers by the Ministry of Science, Research, and Technology between the years 2007 and 2010, and whose names were published in bulletins of various scientific gatherings as top researchers. Then the study sample was limited to 106 researchers who are faculty members in disciplines mentioned in Iran’s Holistic Scientific Map with attention to the disciplines’ priorities. Among these numbers, 34 were from medical science disciplines, 19 from humanities and social sciences, 23 from engineering sciences, and 30 from natural sciences. The scientific performance of all members of the study sample was determined by comprehensive searches in national (Magiran, SID, Noormags, and so on) and international (ISI Web of Science, Scopus, Pubmed, and so on) bibliometrics and citation databases separately, and completed based on the research resume of each researcher. This information was entered in predesigned checklists and the duplicate items from different databases were removed. Finally these checklists were verified by all 106 members of the sample, so the checklists were provided by using documentary and survey techniques.
To answer the first question of this research project, based on the total data obtained from the checklists, the ratios of any information formats in each subject area were calculated.
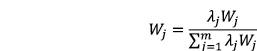
Then, in order to compare values (second question) and by using evaluative techniques, the data gathered from the research production performance of the population in regard to its dispersion was weighted using Shannon entropy method. Independently in each of the subject areas, the mentioned method’s formula (ΣPi × ln (pi)) was applied on the scientific production of each member. Using this method a weight (Wj) was determined for each type of scientific production in each field. Also, since the factor of “quantity” and “significance” are both important in calculating the final weight, with the experts’ opinion (Rezaie, 2012) the values for this factor (λj) were also determined and used in the following equation (Wj1):

Also in order to create comparability between the values of scientific productions of different fields, a weighted average method (Wj) was used to determine the weight of scientific productions in each field compared to other fields. Again the significance of these new weights was determined with the experts’ opinion (λj) (Rezaie, 2012) and used in the above equation (Wj2). Finally the overall weight for each type of scientific production was determined as the product of two previous weights (
In order to answer the third question with the help of these weights, in accordance with paired comparison matrixes which are used in the Analytic Hierarchy Process (AHP), all types of scientific productions were valued compared to each other in all different fields. This matrix is able to measure and compare these values relative to each other. Then pairwise comparison matrixes were calculated for comparison between each two fields.
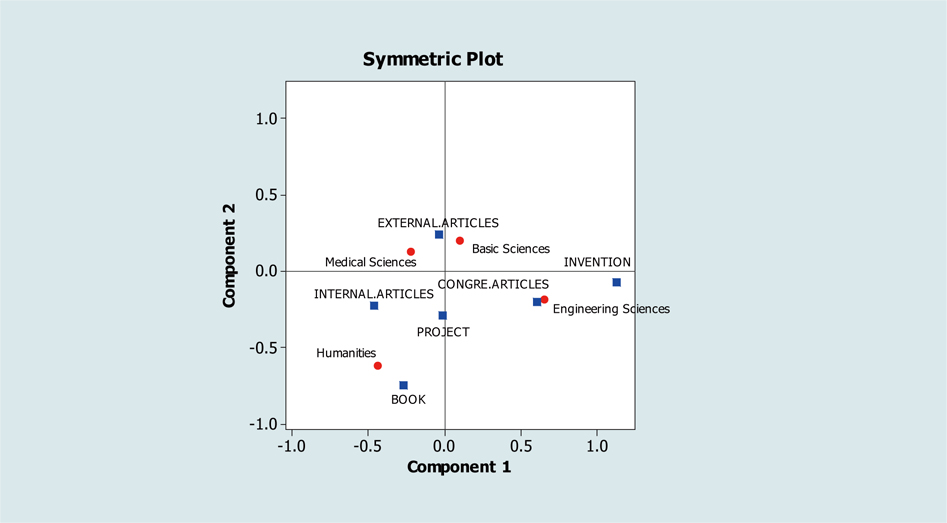
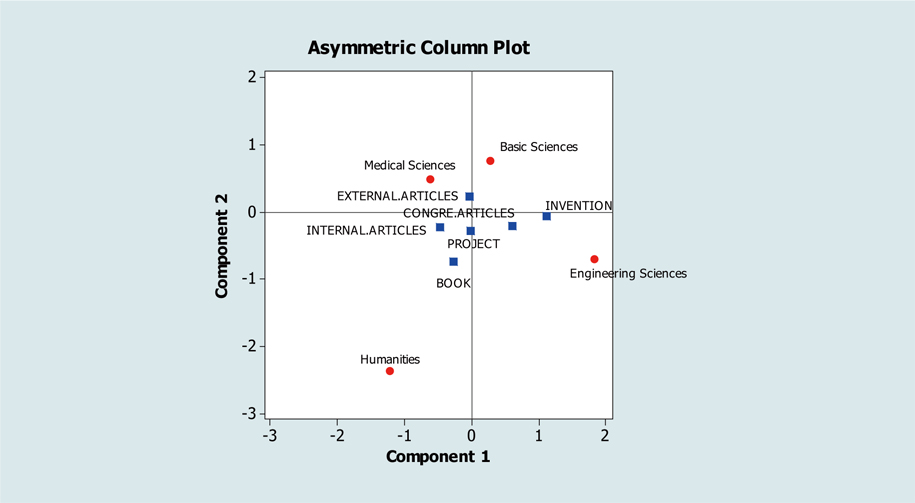
Figs. 1 and 2 were obtained by the Correspondence Analysis method in Minitab 16 software.
The most active scientific field in each type of publication is shown in Table 1 and Figure 1. As can be seen in Figure 1, the highest relation between different data forms in different fields is shown as the least distance between them.
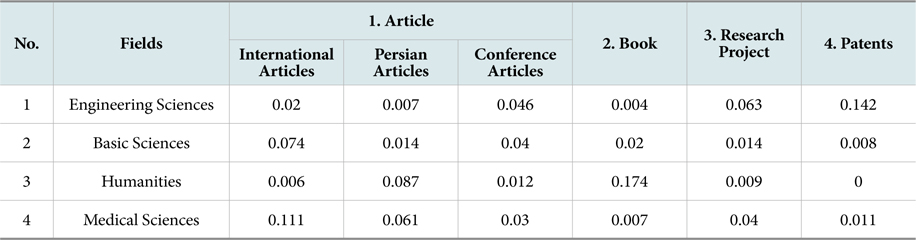
[Table 1.] The Proportion of Scientific Publications among Fields in Each Type
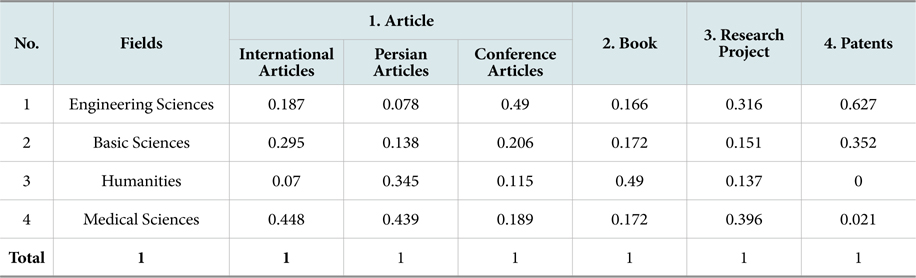
The Proportion of Scientific Publications among Fields in Each Type
Based on the obtained data, the field of medical sciences with 0.45 of all international articles was the most active field in this type of publication. In regards to Persian articles, again medical sciences with 0.44 of all publications was the most active field. In conference articles, engineering sciences with 0.49 of all publications was the most active field while humanities and social sciences with 0.49 of all book publications was the most active field in this type of publications. Also medical sciences with 0.4 of all research projects, and engineering sciences, with 0.63 of all patents, were the leading fields among these types of publications.
Then, according to research goals, the weight of each type of scientific publication in each field was determined using the number of publications and the significance of each type of publication in each field (Rezaie, 2012). The sum of all weights is equal to 1 in order to make it possible to compare different types of publications.
By investigating the calculated weights (Table 2), in the field of engineering sciences the highest weights in descending order belonged to patents (0.142), research projects (0.063), conference articles (0.046), international articles (0.02), Persian articles (0.007), and books (0.004). In natural sciences the highest weights belonged to international articles (0.074), conference articles (0.04), books (0.02), Persian articles and research projects (0.014), and patents (0.008), and in humanities and social sciences, the highest weights belonged to books (0.174), Persian articles (0.087), conference articles (0.012), research projects (0.009), and international articles (0.006). Finally, in the field of medical sciences, the highest weights belonged to international articles (0.111), Persian articles (0.061), research projects (0.04), conference articles (0.03), patents (0.011), and books (0.007).
[Table 2.] The Weight of each Type of Scientific Publications of Fields in the Entire Complex
The Weight of each Type of Scientific Publications of Fields in the Entire Complex
Fig. 2 shows the relation of each type of scientific publication with different fields. In this figure the closeness of each data form for each field is shown by considering its total weight.
By calculating the value for each type of scientific publication, it is possible to calculate the equal scientific production score of each field based on each publication type or other data forms in other fields. Therefore it will be possible to compare the scientific production of each field with other productions in the same field, as well as productions of other fields. For example, Table 3 shows the value of engineering scientific production based on the same field while Table 4 compares these scientific productions to those of natural sciences.
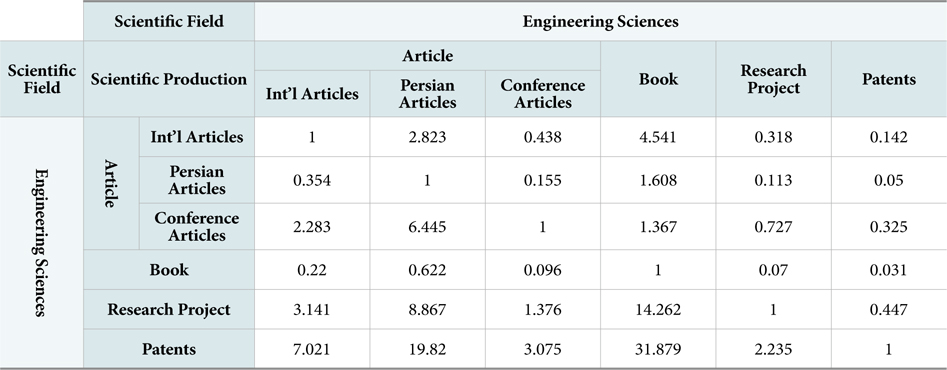
The Proportion of Each Type of Engineering Scientific Production to other Types in the Same Field
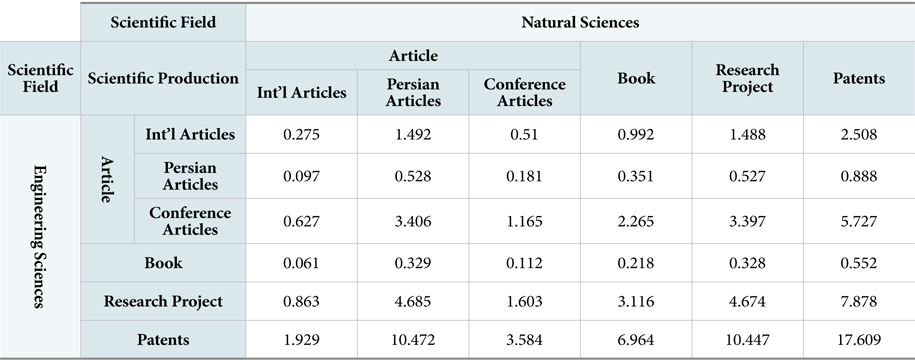
The Proportion of Each Type of Engineering Scientific Production to Those of Natural Sciences
Schubert and Braun (1996) state that it is not correct to use the sheer number of publications and citations for evaluation and that first it is necessary to standardize and normalize these data. By weighting the publications of top researchers in every field and determining the importance of each publication type according to the researchers, it is possible to obtain a weight for each scientific source which shows the value of each scientific production compared to all others. Since these weights are determined based on frequency and significance, if the significance of a certain type of publication increases in a certain subject area, its weight will also increase.
These weights enable us to determine the comparative net value of each data type based on other data types in the same or other subject areas, or the same data type in other subject areas. Therefore, as the matrixes presented in the findings show, it is possible to calculate the value of each data type compared to other data types. For example if we need to convert all publications of a certain researcher in a certain discipline just as engineering sciences to international articles, it is possible to obtain a number for each researcher in that discipline that is the equivalent of their publications in terms of international articles and then compare these numbers. By using the matrix presented in table 3 which shows the ratio of each type of publication in this field compared to other publication types, normalization will be possible.
For example, in the field of engineering the number of international articles is multiplied by 1, the number of Persian articles is multiplied by 0.354, the number of conference articles is multiplied by 2.283, the number of books is multiplied by 0.220, the number of research projects is multiplied by 3.141, and the number of patents is multiplied by 7.021. Then these calculations are carried out for scientific productions of all researchers in the field (in all levels including research groups, departments, universities, and national level) and then the results are ranked. As Torres-Salinas et al. (2011) state in their work, it is necessary to compare the scientific productions of academic institutions. Also in this regard, Narin et. al. state that in scientometrics, the weights of n articles is equal to the weight of 1 book that is used repeatedly, and also emphasize that the value of n cannot be constant (as cited in Noroozi Chakoli, 2011). Archanbault and Gagne (2004) also state that in order to conduct a precise scientometrics evaluation of humanities and social sciences and to determine the coverage of these disciplines in international databases, especially those in English, it is useful to know the exact ratio of articles, books, conference reports, government reports, and other types of publications based on local tendencies of each discipline.
In order to determine these ratios, an extensive study on a number of local and international universities needs to be conducted which first concentrates on a small number of disciplines, extending its reach further as the need arises. Also in normalization studies one needs to consider the number of research efforts based on local tendencies and their influence on bibliometrics evaluations. Also, studies need to consider the ratio of location-oriented studies, especially those published in journals with limited distribution (Archanbault & Gagne, 2004). According to Larivière et al. (2006), by correctly calculating the share of each publication type in scientific communications, it is possible to evaluate the credibility of bibliometrics methods and ISI databases. By normalization of publications based on publication type and number of authors, Kyvik (1989) concludes that there was no significant difference between various disciplines.
There are several limitations that need to be overcome in order to achieve a detailed and precise evaluation of scientific productions. These limitations are on one hand due to differences in characteristics and philosophies and publication and citation behaviors of different fields, and on the other hand due to lack of tools, methods, and databases that can counter the effects of these differences. In order to make it possible to compare scientific production factors of various fields it is necessary to have adjusted and normalized scientometrics and bibliometrics indicators and tools. As shown above, to this day other than some suggestions about normalization of current indicators or the creation of a database that covers all sources and languages, which is a costly and ineffective method, no operational solution for countering these limitations exists. Therefore this study has aimed to offer an applicable solution for this problem by calculating normalized weights of different publication types. To this end, top Iranian researchers in engineering, natural sciences, humanities and social sciences, and medical sciences, and their research performances were investigated and the weights, values, and ratios obtained from this investigation were used in order to propose a method for comparing the research performance of various fields.
The calculated weight of each type of scientific publication in each field presented in comparison tables makes it possible to compare scientific production components in different fields. Also, since the ratios are calculated by dividing the weight of each type of scientific publication in each field by the number of that type of publication, the effect of number of publications in each field is included in the calculated ratios.
In this study the research performance of the study population in different formats was investigated and the reported values and ratios consider these differences.
Therefore, by the special properties of the ratios and weights presented in this work, it is possible to normalize even indexes designed for comparing large levels such as Crown indicator, citation index, anti- logarithmic index, and other similar indexes. These results are also useful in normalization of comparison methods suggested by other researchers in order to compare various disciplines.