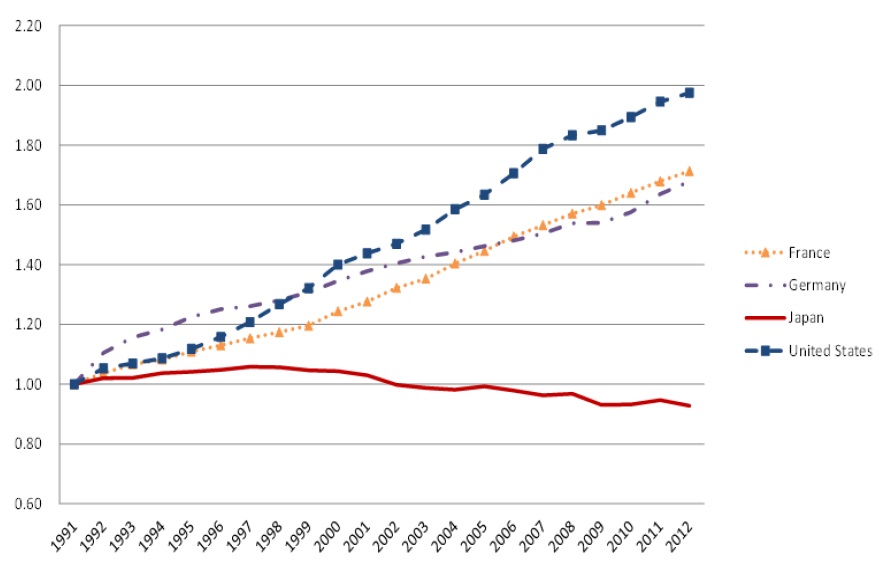
In the 1990s and the 2000s, the average nominal wage in Japan declined continuously.1 This is a sharp contrast to wage trends in other developed countries in the same period. As shown in Figure 1, OECD statistics indicate that the average nominal wage in the United States was 97 percent higher and that Germany 68 percent higher in 2012 than in 1991. On the other hand, in Japan, the average nominal wage has been declining since 1997 and in 2012 was 7 percent lower than in 1991. Against this background, Japanese Prime Minister Shinzo Abe recently asked business leaders to raise wages, reflecting the administration’s resolve to accelerate the battle against chronic deflation (The Japan Times 2013). Some companies responded, with Lawson, a convenience store chain, for example, raising bonuses for their regular workers (Nikkei Shimbun 2013), Moreover, Toyota, the car manufacturer, and Hitachi, a major electrical machinery conglomerate, promised to increase base wages in the so-called wage “spring offensive” (SankeiBiz 2014).
Yoshikawa (2013) argued that the wage decline was due to both the rise in the number of low wage workers such as non-regular workers and a wage decline among regular workers. Meanwhile, Kuroda and Yamamoto (2006), using data from the
Given these considerations, the present study seeks to provide new evidence on the possible factors contributing to the nominal wage decline in Japan’s so-called “two lost decades” of the 1990s and the 2000s by quantitatively examining the causes of the decline in nominal wages for the economy as a whole as well as at the industry level. To do so, we decompose the wage decline into three factors, namely, changes in industrial structure, changes in the composition of the workforce, and changes in the wage structure, using micro data from the
Specifically, employing the Blinder-Oaxaca decomposition technique,3 we decompose microdata by industry for three different subperiods between 1993 and 2008, which represent different phases of the business cycle:4 (1) the period of stagnation from 1993 to 1998 following the burst of the 1980s asset bubble; (2) the period of stagnation and deflation period from 1998 to 2003 following the Asian financial crisis; and (3) the period of the export-driven recovery from 2003 to 2008.5 Employing the Blinder-Oaxaca approach allows us to decompose wage changes into the following three effects: (a) the “endowment effect,” which shows the effect of changes in the share of workers with different wages; (b) the “coefficient effect,” which captures wage changes of workers that are similar in terms of their tenure, educational attainment, sex, hours worked, work status (full-time or part-time), region, and size of firm they work for in the same industry; and (c) the “interaction effect.”
Our decomposition results suggest that the wages of workers in exportoriented industries such as manufacturing and wholesale did not necessarily decline, but those in most domestic service industries dropped sharply. This suggests that, contrary to the popular view in Japan that export oriented industries contributed to the wage decline in the 2000s, low productivity growth in domestically-oriented industries was responsible for the wage decline overall.
The remainder of this paper is organized as follows. Section II explains the data and methodology we use for our econometric analysis. Section III presents the decomposition of wage trends using the Blinder-Oaxaca approach and microdata from the
1There are numerous studies that examine nominal wage dynamics in other countries, including Elsby (2009) for the United States and Great Britain, and Christofides and Li (2005) for Canada. Dickens et al. (2007) provide microeconomic evidence on how wages have changed for workers in 16 countries and found that Ireland, Denmark, and France show only slight downward rigidity in nominal wages, while Portugal and the United States show strong downward rigidity. 2Examining wage rigidity in Japan, Kimura and Ueda (2001) found that nominal wages showed downward rigidity when using data for the period from 1976 to 1998, although no downward rigidity was observed using data from 1976 to 2000. Similarly, Kuroda and Yamamoto (2014) found that downward nominal wage rigidity was present in Japan until the late 1990s, but disappeared deafter 1998 as annual wages became downwardly flexible. In contrast, Kambayashi (2011), using a quasi-panel dataset of individual workers from the Basic Survey on Wage Structure for 1993-2006, showed that nominal hourly wages of full-time regular workers were only weakly downwardly rigid and in fact became more rigid from around 2000. 3Since the seminal works of Oaxaca (1973) and Blinder (1973), this methods have been used the most extensively in the labor economics (see, for example, Weichselbaumer and Winter-Ebmer, 2005). Turner and Monk-Turner (2006) use the method to examine gender differences in earnings among South Korean workers. 4As pointed out by Hagedorn and Manovskii (2013), understanding the behavior of wages over the business cycle is a classic yet still open question in economics. That being said, there is a growing body of literature on wages and the business cycle providing a range of findings. They highlight, for example, that wages are history dependent (Beaudry and Dinardo 1991) and that the business cycle conditions at the time of entering the labor market matter for future wages (Hagedorn and Manovskii 2013; Oreopoulous, van Wachter, and Heisz 2012). Although these studies suggest that past aggregate labor market conditions play a role in explaining current wages, it is also clear that wages depend on current macroeconomic conditions. 5Details on the Japanese economy and Japanese economic policy during these periods can be found in Economic and Social Research Institute (2011).
II. Data and Decomposition Methods
The data used was obtained from the
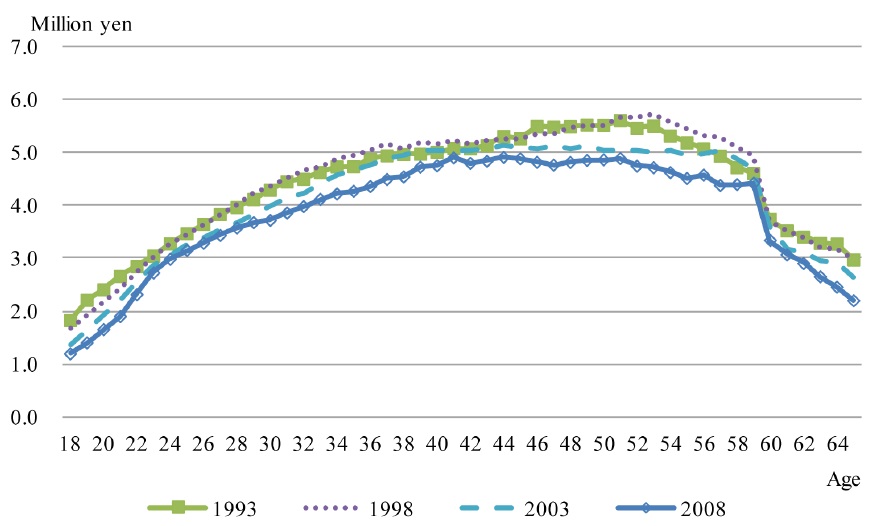
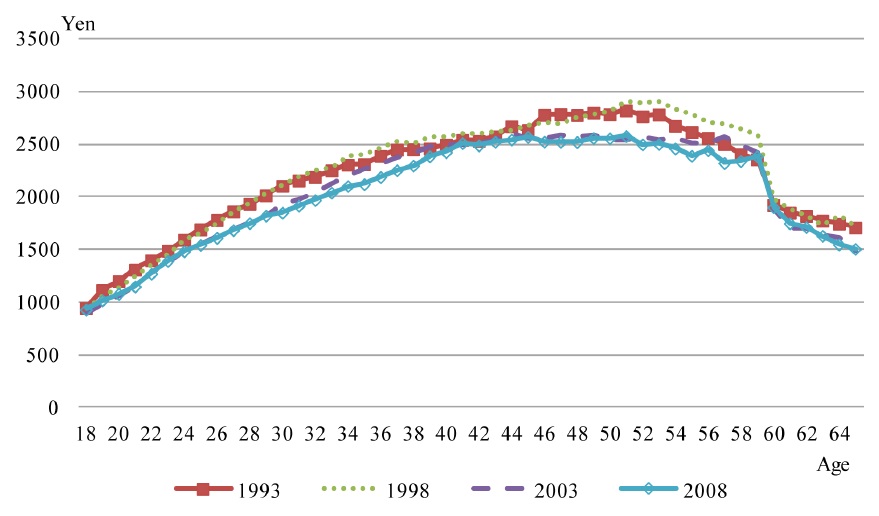
To get a sense of wage developments in Japan, we start with a descriptive analysis of the survey data. Specifically, Figures 2 and 3 present changes in annual and hourly wages by age for four benchmark years. Both figures show that the age-wage curve has shifted downward, with the shift occurring mainly in the 2000s. Moreover, we find that the decline in wages is particularly large for workers in their 30s and early 50s.7
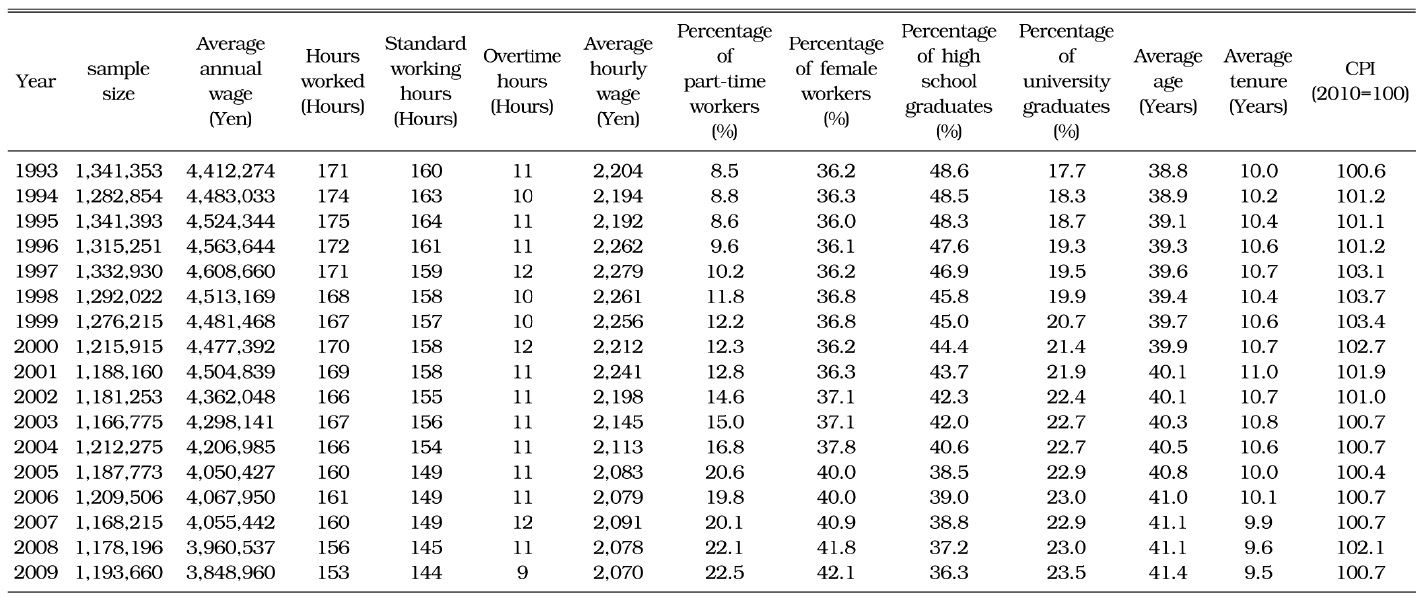
Next, Table 1 presents annual descriptive statistics for our dataset. We find that the average annual wage rose from 4.41 million yen in 1993 to 4.61 million yen in 1997, but then steadily declined thereafter, falling to 4.5 million yen in 2002, 3.96 million yen in 2008, and 3.85 million yen in 2009.8 Monthly hours worked follow a similar pattern, rising from an average of 171 in 1993 to 175 in 1995 before declining to 153 in 2009. Hours worked can be broken down into standard working hours and overtime hours. In 1993, the average worker worked 160 standard working hours per month and 10.7 hours of overtime. These figures drop to 144 standard working hours and 8.6 overtime hours for 2009. Meanwhile, hourly wages peaked at 2,279 yen in 1997 and then steadily declined to 2,070 yen in 2009. Next, looking at the percentage of part-time workers, we find that this increased throughout the period, almost tripling from 8.5 percent in 1993 to 22.5 percent in 2009. The percentage of female workers gradually increased from 36.2 percent in 1993 to 42.1 percent in 2009. As for the educational attainment of employees, the share of junior high and high school graduates steadily declined, while the share of two-year college, vocational school, and university graduates increased. Further, while the average age of workers stood at 38.8 years in 1993, this had risen to 41.4 years in 2009. Finally, average tenure increased from 10.0 years in 1995 to a peak of 11.0 years in 2001 before dropping to 9.5 years in 2009.
[TABLE 1] DESCRIPTIVE STATISTICS
DESCRIPTIVE STATISTICS
We examine the factors underlying wage changes over time using the Blinder-Oaxaca. For robustness check, we also employ the Cotton, Reimers, and Neumark decomposition methods.
Suppose we have a variable,

We assume

where the vector of

where

Representing the three terms on the right-hand side of equation (4) by E (for the “endowment effect”),
The following equations (5) and (6) are special cases of equation (4):


We can also rewrite Oaxaca’s decomposition as a special case of the following decomposition:

where


Cotton (1988) suggested weighting the differences in the

where

In addition to Oaxaca’s two decompositions and the methods proposed by Cotton and Reimers, another decomposition method is that by Neumark (1988), which makes use of the coefficients obtained from the pooled data regression,

In our regression analysis in the next section, we employ the following decomposition method.9 First, we decompose the wage change in all industries from 1993 to 2008 into the endowment, coefficient, and interaction effects. This allows us to examine the contribution of industrial structural change to the trend in the average wage for the economy as a whole. Second, using information by industry and subperiod on annual salaries (dependent variable) and monthly hours worked (standard working hours worked plus overtime hours), the employment status (part- time or full-time), sex, educational attainment, tenure, tenure squared, the region where an establishment is located, and firm size (explanatory variables), we decompose wage changes in different industries and subperiods into the contribution of changes in the structure of the workforce and changes in the wage structure.
6In this study, we only use data on “regularly” employed workers. Regular workers are defined in the Basic Survey on Wage Structure as follows: 1) Employees hired for an indefinite period, 2) Employees hired for longer than one month, or 3) Employees hired for less than one month or by the day and who were hired for 18 days or more in April and May. Both ordinary workers (to whom general scheduled working hours are applied) and part0time workers (regular workers whose scheduled working hours a day or a week are less than those of general workers in establishments) are the regular workers. Observations for temporarily employed workers are not included in our analysis. Before 2005, workers were classified into two categories, “regularly” and “temporarily” employed. Since 2005, workers have been classified into five categories, namely, “full-time employees without a stipulated contract period,” “full-time employees with contract period stipulations,” “non-full-time employees without a stipulated contract period,” “non-full-time employees with contract period stipulations,” and “temporary employees.” Furthermore, the terminology regarding part-time workers changed at the same time. Therefore, changes in 2004 and 2005 are possibly affected by changes in the way workers are categorized. 7Using the Basic Survey of Wage Structure from 1998 to 2008, Hamaaki et al. (2012) examine structural changes in Japan’s labor market focusing on the relationship between tenure and wages. They found that older workers no longer enjoy the same wage increases as in the past. 8Annual wages are calculated as the total of monthly wages multiplied by 12 plus bonuses paid the previous year. 9The technique is often used to analyze wage gaps by sex or race. According to Cahuc, Carcillo, and Zylberberg (2014), “the Blinder-Oaxaca decomposition aims at decomposing the mean wage across these groups: a reference group and another group to be compared to the reference group…. Decomposition methods can be applied to other types of outcomes and agents, such as gaps in test scores between schools. (p. 59)” The example of the method applied to time series data is found in Ikenaga (2011).
>
A. Contribution of changes in industrial structure
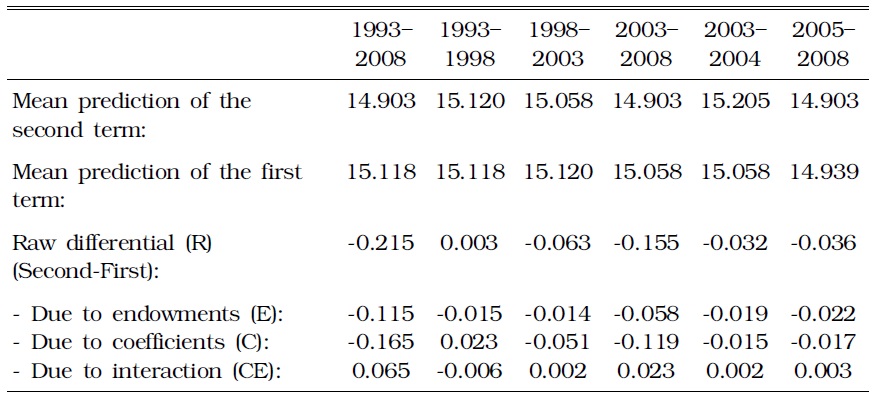
We start by examining the role of changes in industrial structure. Table 2 shows the change of the log of the average annual wage for the entire observation period from 1993 to 2008, for the subperiods 1993-1998, 1998-2003, and 2003-2008 mentioned above, as well as for the period 2003-2004 and 2005-2008. The table shows that between 1993 and 2008 the average wage dropped by 22 percent. While no substantial change in wages from 1993 to 1998 can be observed, wages dropped by 6 percent from 1998 to 2003 and by 16 percent from 2003 to 2008; in 2003-2004 and 2005-2008, wages declined by 3 and 4 percent, respectively. Thus, we find a clear downward trend in wages after 2003. Moreover, looking at the decomposition, we find that of the 22 percent wage decline from 1993 to 2008, 12 percentage points are explained by changes in industrial structure and 17 percentage points are explained by a drop in the average wage of workers in the same industries.10
[TABLE 2] DECOMPOSITION OF CHANGES IN ANNUAL WAGES: 1993-2008

DECOMPOSITION OF CHANGES IN ANNUAL WAGES: 1993-2008
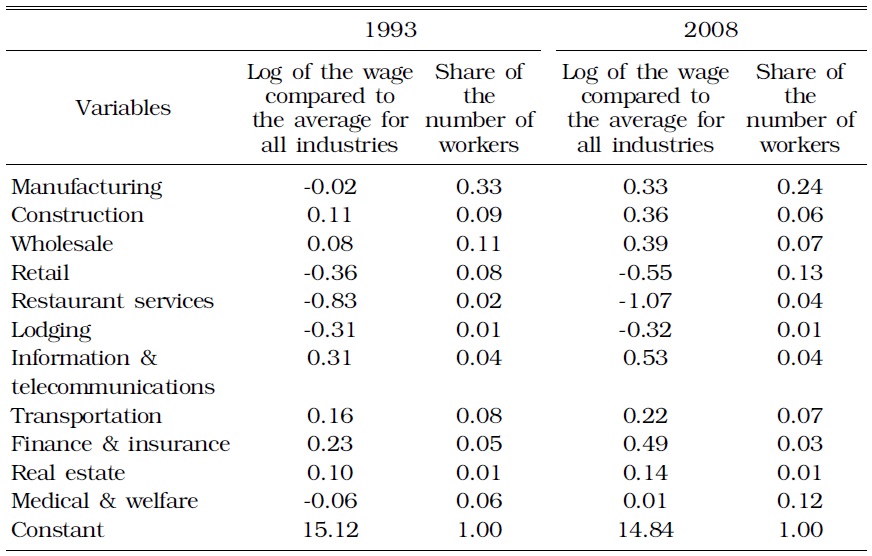
Thus, about half of the wage decline can be explained by changes in industrial structure. This means that the share of workers in industries with high wages decreased and vice versa. Looking at developments by industry in detail, we find that the share of the manufacturing sector in terms of the number of workers was 33 percent in 1993, but this dropped to 24 percent in 2008 (Table 3). In 1993, the average wage per worker in the manufacturing sector was 1 percent (=exp(-0.02)) lower than the average for all industries, but in 2008 it was 39 percent (=exp(0.33)) higher than the average for all industries. Meanwhile, the retail industry accounted for 8 percent of workers in 1993 and 13 percent in 2008. The wage level of workers in the retail industry in 1993 was 30 percent (=exp(-0.36)) lower than the average for all industries, and by 2008 this gap had increased to 58 percent (=exp(-0.55)). Finally, the share of workers in the restaurant services sector increased from 2 percent in 1993 to 4 percent in 2008. In 1993, the wage of workers in the restaurant services industry was 56 percent lower (=exp(-0.83)) than the average for all industries, and by 2008 this gap had increased to 66 percent (=exp(-1.07)).
[TABLE 3] AVERAGE WAGES AND THE SHARE OF THE NUMBER OF WORKERS BY INDUSTRY: 1993-2008

AVERAGE WAGES AND THE SHARE OF THE NUMBER OF WORKERS BY INDUSTRY: 1993-2008
>
B. Decomposition by Industry
a) Whole Observation Period (1993 to 2008)
Next, we decompose wage changes at the industry level and by subperiod in order to examine the contribution of the endowment effect, which represents changes in the composition of the workforce, and the coefficient effect, which represents changes in the wage structure of workers in the same industry.11
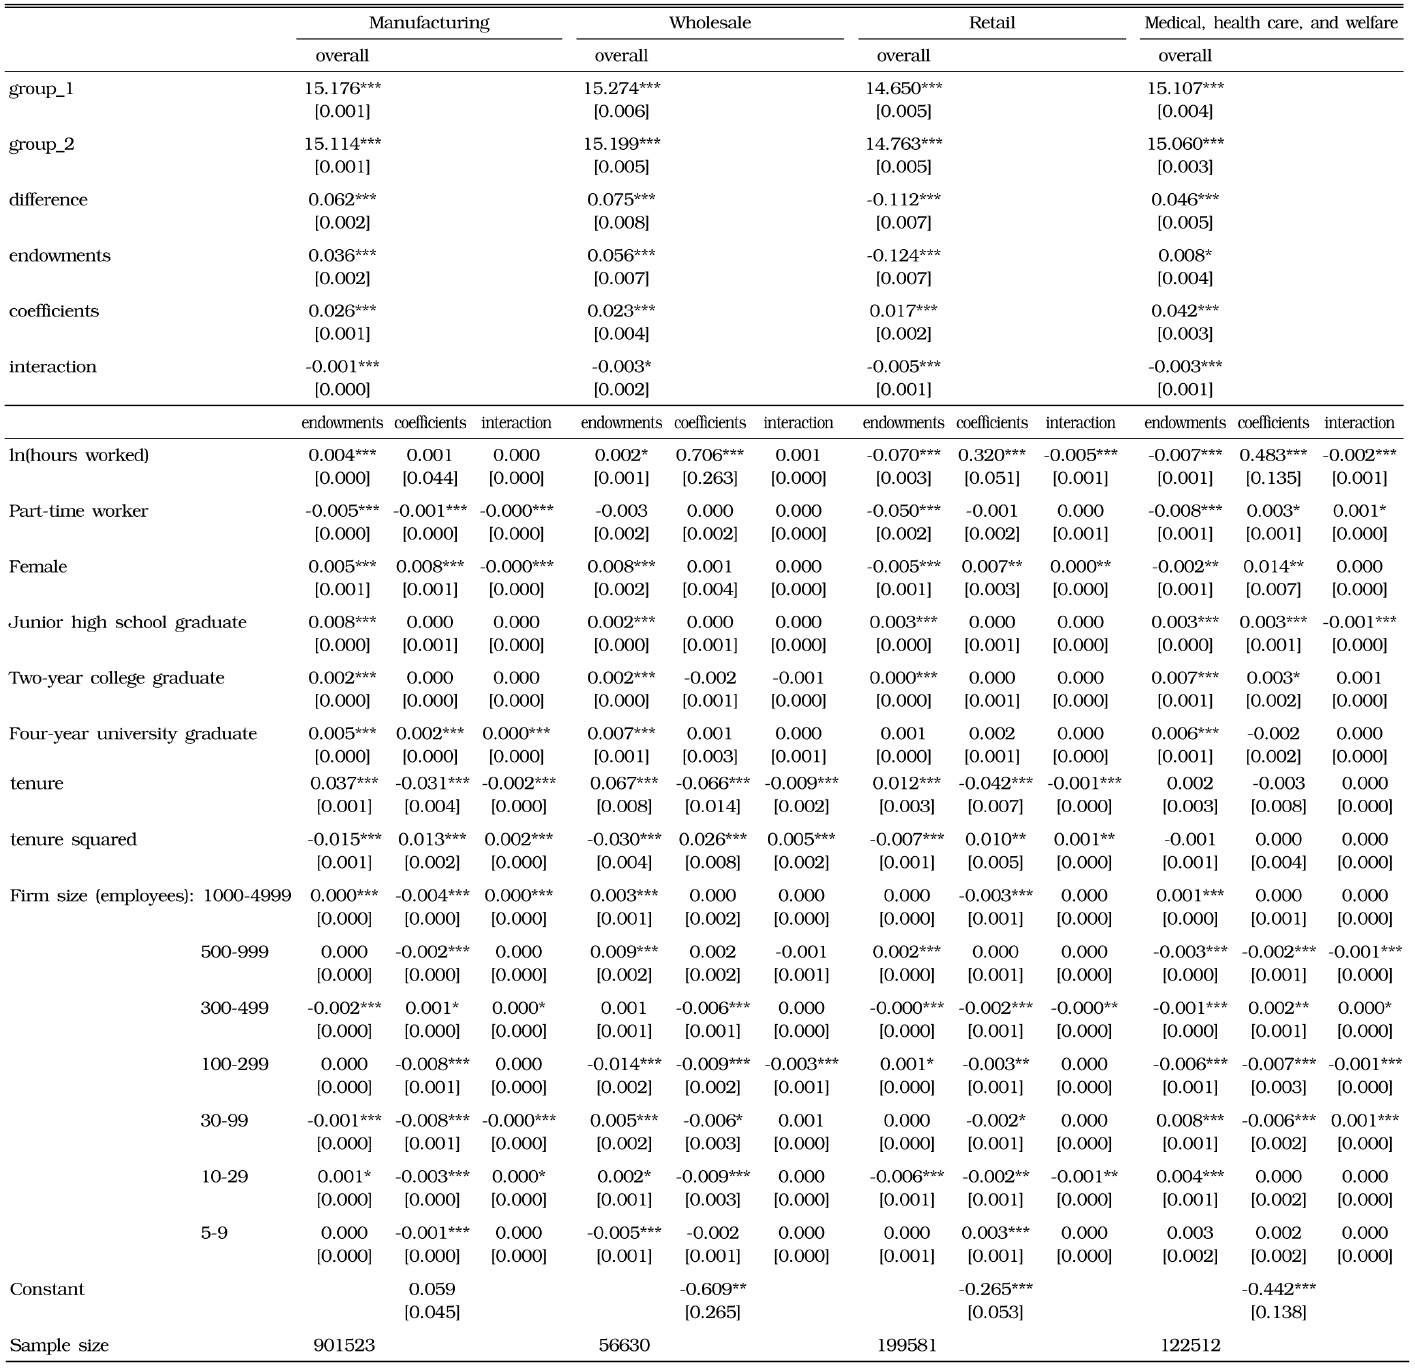
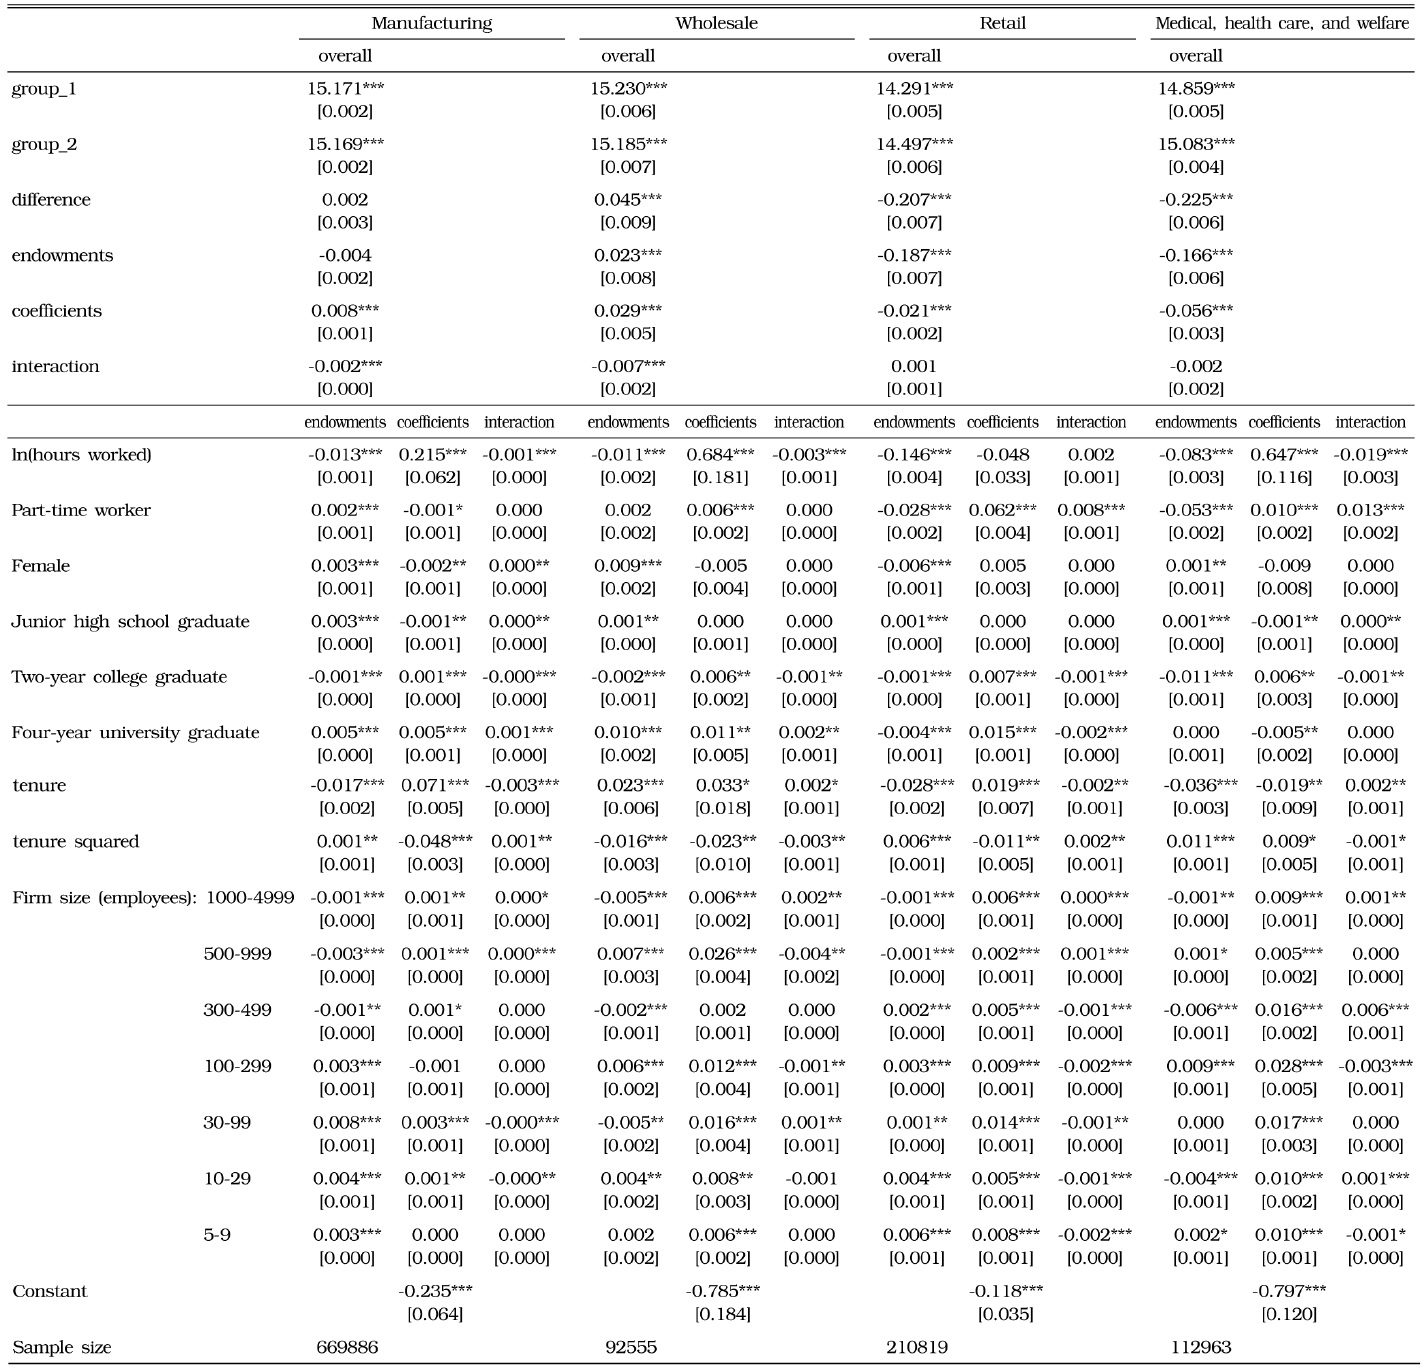
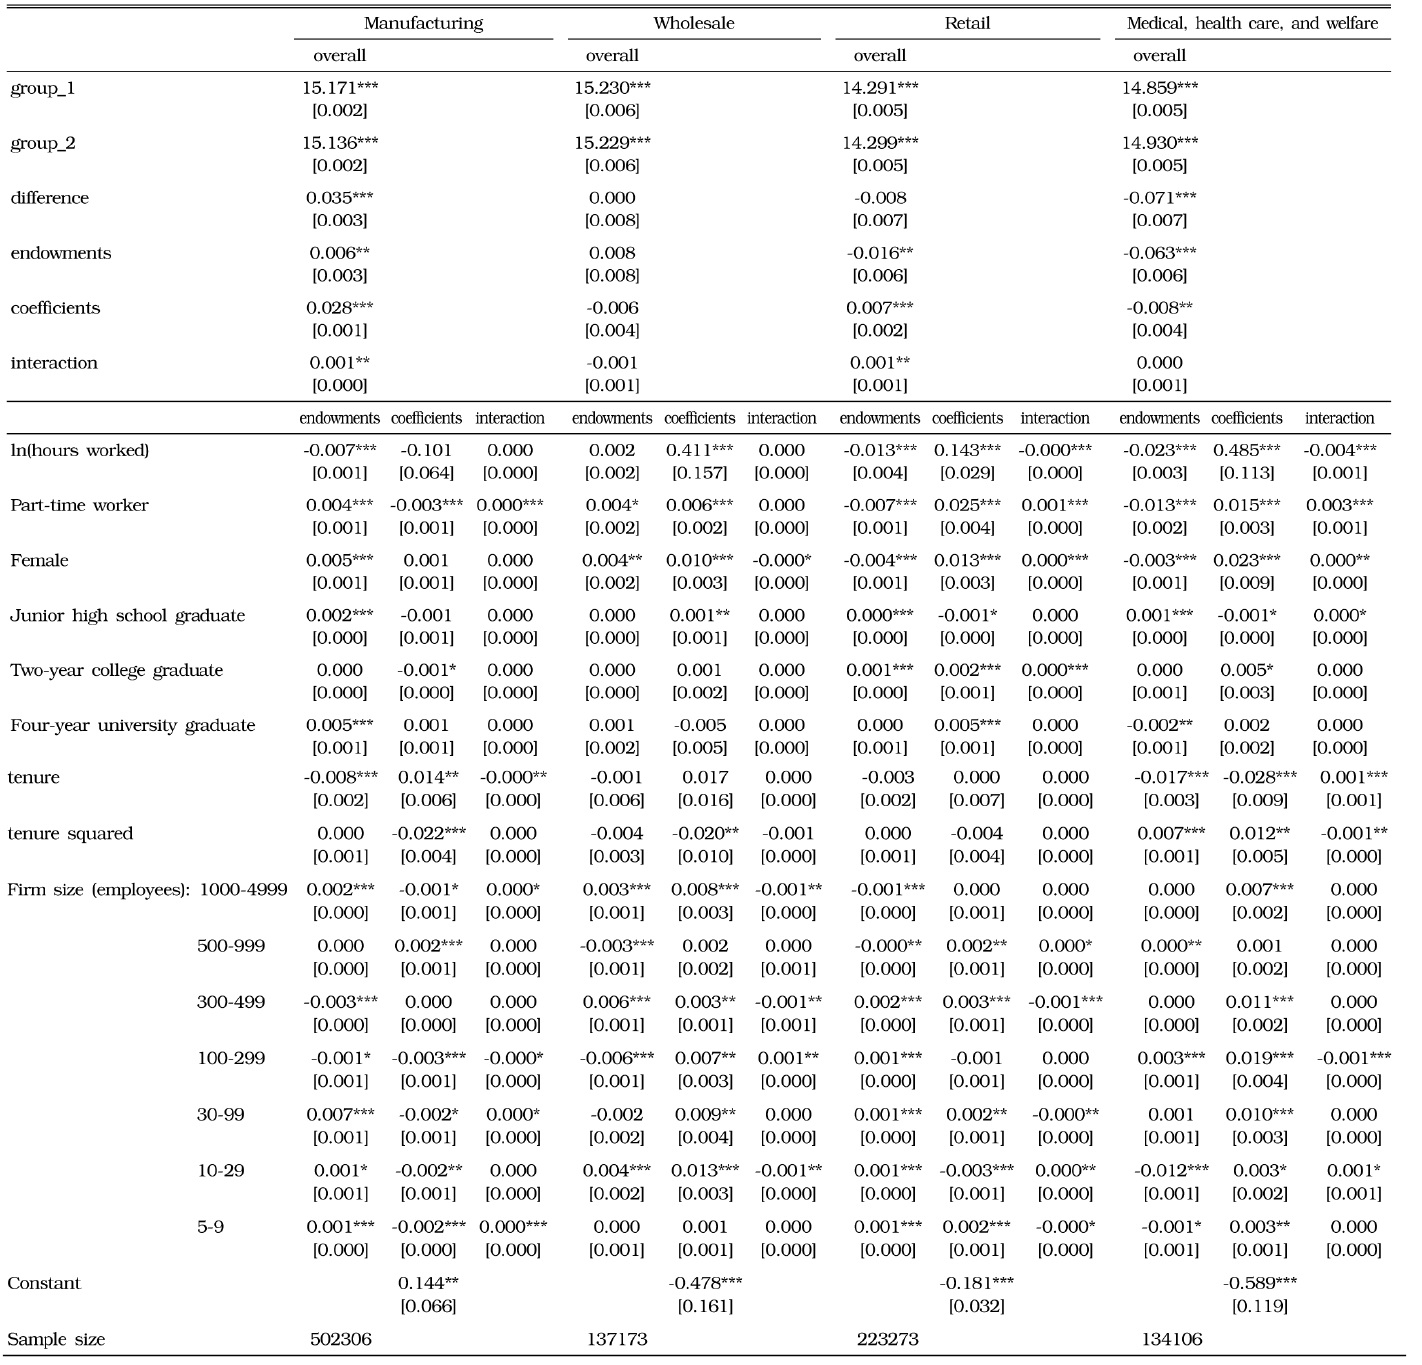
The results for the observation period as a whole (1993-2008) are shown in Table 4. When controlling for tenure, educational attainment, sex, hours worked (standard hours worked plus overtime hours), work status (full-time/part-time), region, and firm size, the average annual wage of workers in manufacturing industry increased by 6 (=exp(0.057)) percent between 1993 and 2008. Of that 6 percent increase, the endowment effect accounts for 8 percentage points, while the coefficient effect accounts for -2 percentage points. In other words, in manufacturing industry, the change in the composition of the workforce had a greater impact on the average wage than changes in the wage structure. Next, the average wage in the wholesale industry rose by 3 percent (=exp(0.030)). Of this 3 percent change, the endowment effect and the coefficient effect accounted for 6 percentage points and -3 percentage points, respectively. The values for tenure and tenure squared for the wholesale industry in Table 4 indicate that it is the aging of the workforce that is responsible for the increase in the average wage during this period. Next, the average wage in the retail industry dropped by 38 percent (=exp(-0.472)). The endowment effect is much larger than the coefficient effect, and the largest contributing factors to the endowment effect are the number of hours worked and the number of part-time workers. During the observation period, the number of part-time workers increased, while the average number of hours worked decreased. Further, the average wage in the medical, health care, and welfare industry fell by 18 percent (=exp(-0.201)) between 1993 and 2008. Of this drop, the endowment effect accounted for -11 percentage points of the change, while the coefficient effect accounted for -7 percentage points. The main contributing factors to the coefficient effect are the number of hours worked and the constant term. In sum, wage changes in the manufacturing, wholesale, and retail industries can be largely explained by changes in the composition of the workforce. On the other hand, in the medical, health care, and welfare industry, half of the wage drop can be attributed to changes in the composition of the workforce and the other half to changes in the wage structure.
[TABLE 4] INDUSTRY-LEVEL BLINDER-OAXACA DECOMPOSITION: 1993-2008

INDUSTRY-LEVEL BLINDER-OAXACA DECOMPOSITION: 1993-2008
b) Subperiod from 1993 to 1998
Having decomposed wage changes at the industry level for the observation period as a whole we now decompose them for the three different subperiods,
The average annual wage of worker in manufacturing industry increased by 6 percent (=exp(0.062)) between 1993 and 1998. Of that 6 percent increase, the endowment effect accounted for 4 percentage points, and the coefficient effect accounted for 3 percentage points. Similarly, in the wholesale industry the average annual wage rose by 8 percent (=exp(0.075)), and of this 8 percent change, the endowment effect and the coefficient effect accounted for 6 percentage points and 2 percentage point, respectively. Thus, in the wholesale industry, almost all of the change in wages during this period is explained by the endowment effect, and the largest contributing factor to the endowment effect is tenure, indicating that it is the aging of the workforce that is responsible for the increase in wages during this period. On the other hand, the average wage in the retail industry dropped by 11 percent (=exp(-0.112)), with the endowment effect accounting for -13 percentage points and the coefficient effect accounting for +2 percentage points. The largest contributing factors to the endowment effect are the number of hours worked and the number of part-time workers. That is, the number of part-time workers increased during this period and the average number of hours worked decreased. Finally, the average wage in the medical, health care, and welfare industry before controlling for worker characteristics rose by 5 percent (=exp(0.046)) between 1993 and 1998. Of this 5 percent change, the endowment effect accounted for 1 percentage point, while the coefficient effect accounted for 4 percentage points. The main contributing factor to the coefficient effect is the number of hours worked. Thus, during this period, the average annual wage decreased even though hours worked increased.
[TABLE 5] INDUSTRY-LEVEL BLINDER-OAXACA DECOMPOSITION: 1993-1998

INDUSTRY-LEVEL BLINDER-OAXACA DECOMPOSITION: 1993-1998
c) Subperiod from 1998 to 2003
Next, we examine wage developments during the second subperiod from 1998 to 2003 (Table 6).
[TABLE 6] INDUSTRY-LEVEL BLINDER-OAXACA DECOMPOSITION: 1998-2003

INDUSTRY-LEVEL BLINDER-OAXACA DECOMPOSITION: 1998-2003
Controlling for the same variables as above, the average annual income of workers in manufacturing industry fell by 1 percent (=exp(-0.007)). The endowment effect accounted for +5 percentage points of the change, while the coefficient effect accounted for -5 percentage points. The main contributing factor to the coefficient effect is the constant term. This means the wage of workers with the same characteristics dropped because of a decline in overall wages. In the wholesale industry, the average wage dropped by 9 percent (=exp(-0.090)). The drop is entirely due to the coefficient effect, and we find that the main contributing factor is the negative constant term, indicating that during this period the average wage of workers working in the wholesale industry declined. The average wage of workers in the retail industry also fell, by 15 percent (=exp(-0.153)). Of this decline, the endowment effect accounted for -12 percentage points, while the coefficient effect accounted for -4 percentage points. The largest contributors to the endowment effect are the number of hours worked and the number of part-time workers, that is, the increase in the number of part-time workers and the decrease in the average number of hours worked during this period by the fact that the number of part-time workers at large-scale retail stores increased. Finally, the average wage of workers in the medical, health care, and welfare industry fell by 2 percent (=exp(-0.023)) between 1998 and 2003, with the endowment effect accounting for +3 percentage points and the coefficient effect accounting for -5 percentage points. The main factor contributing to the coefficient effect is the negative constant term, indicating that in this period the wage in the medical, health care, and welfare industry declined because of a decline in overall wages.
d) Subperiod from 2003 to 2008
Finally, we examine wage changes by industry for the subperiod from 2003 to 2008 controlling for the same variables as above. The results are shown in Table 7.
[TABLE 7] INDUSTRY-LEVEL BLINDER-OAXACA DECOMPOSITION: 2003-2008

INDUSTRY-LEVEL BLINDER-OAXACA DECOMPOSITION: 2003-2008
We find that the average annual income of workers in manufacturing industry did not change between 2003 and 2008. In the wholesale industry, the average wage rose by 5 percent (=exp(0.045)) during this period, with the endowment effect accounting for 2 percentage points and the coefficient effect accounting for 3 percentage point. Finally, the average wages of workers in the retail and the medical, health care, and welfare industries dropped by 21 percent (=exp(-0.207)) and 23 percent (=exp(-0.225)), respectively. However, these large declines likely partly reflect changes in the way workers are categorized rather than actual changes in wages in these industries. Therefore, in the next subsection, we repeat our analysis for the subperiods 2003-2004 and 2005-2008 and discuss the results for these two industries there.
e) Subperiods from 2003 to 2004 and from 2005 to 2008
Because of the changes in the way workers are categorized in 2005, which may have distorted our results, we repeat the analysis for the subperiods 2003-2004 (Table 8) and 2005-2008 (Table 9).
[TABLE 8] INDUSTRY-LEVEL BLINDER-OAXACA DECOMPOSITION: 2003-2004

INDUSTRY-LEVEL BLINDER-OAXACA DECOMPOSITION: 2003-2004
[TABLE 9] INDUSTRY-LEVEL BLINDER-OAXACA DECOMPOSITION: 2005-2008
INDUSTRY-LEVEL BLINDER-OAXACA DECOMPOSITION: 2005-2008
The wage changes by industry for the subperiod from 2003 to 2004 controlling for the same variables as above are shown in Table 8. We find that the average annual income of workers in manufacturing industry did not change between 2003 and 2004. In the wholesale industry, the average wage rose by 3 percent (=exp(0.028)) during this period, with the endowment effect and the coefficient effect each accounting for 1 percentage point. The average wages of workers in the retail and the medical, health care, and welfare industries dropped by 2 percent (=exp(-0.020)) and 3 percent (=exp(-0.033)), respectively.
The results for the subperiod 2005-2008 show that the average annual income of workers in manufacturing industry rose by 4 percent (=exp(0.035)), with the endowment effect and the coefficient effect accounting for 1 percent and 2 percentage points, respectively. In the wholesale industry, the positive endowment effect and the negative coefficient effect canceled each other out, so that there was no significant change in the average wage. The main contributor to the negative coefficient effect was the constant term, which was partly cancelled out by the positive contribution of hours worked. This result indicates that during this period, there was a simultaneous increase in hours worked and a decrease in the average annual wage in the wholesale industry. Meanwhile, the average wage of workers in the retail industry remained unchanged during this period. On the other hand, the average wage of workers in the medical, health care, and welfare industry dropped by 7 percent (=exp(-0.071)), with the endowment effect accounting for -6 percentage points and the coefficient effect accounting for -1 percentage points. These changes likely reflect major changes in the medical, health care, and welfare system since 2000, including the introduction of the nursing care insurance scheme and the deterioration in the finances of the healthcare and nursing care insurance systems, which put downward pressure on wages.
The results for the two subperiods 2003-2004 and 2005-2008 show that the wage change observed in the retail industry was largely due to the change in 2005 in the way workers are categorized, but this change in worker categorization only had a limited effect on measured wage changes in the manufacturing, wholesale, and medical, health care, and welfare industries. We further find that the main contributing factor to the wage changes in 2003-2008 is changes in the composition of the workforce, although changes in wage structure also played a certain role.
10The Blinder-Oaxaca Decomposition of all industry categories in Table 3 were performed, but the results of some industries were omitted due to space limitation. We also employ various alternative decomposition methods, such as the Cotton, Reimers, and Neumark decomposition methods as robustness checks of our estimation results. Our key results are found to be robust to the other decomposition approaches. 11The Blinder-Oaxaca Decomposition of all industry categories in Table 3 were performed, but the results of some industries were omitted due to space limitation.
This paper investigated why the nominal wage in Japan steadily declined during the 1990s and 2000s employing the Blinder-Oaxaca decomposition technique. Using data for the period from 1993 to 2008, we found that the nominal annual wage of regular workers dropped by 22 percent, of which 12 percentage points are due to changes in industrial structure and 17 percentage points are due to a decline in wages within industries. In manufacturing industry, the number of workers decreased, while the average wage increased.12 Sommer (2009) has shown that manufacturing firms granted their employees larger wage increases than firms in other sectors. In service industries, which suffer from low labor productivity,13 average wages fell due to the increase in the number of part-time employees, the decline in the overall hours worked, and the decline in wages of workers with the same characteristics. However, the extent of the decline in average wages differs across service industries. For instance, the wage decline in business-to-business service industries such as finance and insurance, wholesale, and information and telecommunications has been relatively small, while wages in business-to-consumer services such as the retail and the restaurant service and lodging industry have dropped sharply.
Further, we decomposed changes in average wages at the industry level for three subperiods representing different phases of the business cycle in Japan, namely, 1993-1998, 1998-2003, and 2003-2008. Controlling for worker characteristics, we found that wages of workers in the manufacturing, wholesale, and medical, health care, and welfare industries declined between 1998 and 2003. Our results are consistent with the findings of previous studies such as Kimura and Ueda (2001) and Kuroda and Yamamoto (2014) suggesting that 1997 was the turning point in terms of changes in the wage structure. In addition, we find that wages for workers with the same characteristics continued to decline in the 2000s, albeit at a slower pace, and the main factor responsible for the wage decline was changes in the composition of the workforce in the wholesale, retail, and medical, health care, and welfare industries.
While the analysis in this study has shed light on some of the factors underlying the prolonged decline in wages in Japan, there still remain many issues that have not been addressed so far. One of these is the impact of the 2008 global financial crisis on wages, especially in manufacturing industry. Another issue is the relationship between wages and globalization as well as industry and firm characteristics. Yet another area of considerable interest is the relationship between wages and productivity. These are issues left for future research.
12The number of employed workers decreased to 1.3 million in all industries from 1991-2011. During the same period, the number of employed workers in manufacturing industry decreased by over 5 million workers (Ministry of Economy, Trade and Industry 2012). Thus, the period covered in our study saw a significant decline in the number of manufacturing industry employees, which means that our results partly reflect the unobserved effect that wages in manufacturing industry increased because highly-skilled workers stayed employed, while unskilled workers left. 13Using firm-level microdata from 1982 to 2007, Inui et al. (2011) found that total factor productivity growth in non-manufacturing industries was relatively low compared to manufacturing industry. We examine whether the factor contributes to the recent wage decline in Japan from the supply side of labor market or not, but in order to have a complete picture of the decline, we should also analyze the demand side of the market.