Accurate measurement of refractive index is significant in various applications, such as the design of binary optical elements and in the identification of various biomaterials. The existing methods for refractive-index measurement primarily include the Abbe refractometer [1, 2], the minimum-deviation method [3-5], ellipsometry [6-8], the
Laser frequency-shifted feedback was first reported by K. Otsuka in 1979 [21], and since has been widely used in the fields of displacement measurement [22-24], velocity measurement [25], and vibration measurement [26], because of its high sensitivity, simple pumping scheme, and automatic alignment. Considering the high sensitivity of the laser frequency-shifted feedback effect, it has great potential for detection of the weak light intensity reflected by an interface with a very low difference in reflectivity index. Laser feedback interferometry has been used for glass reflectivity-index and thickness measurement [21, 22], based on the optical-path difference caused by rotating the sample; herefore, it does not apply to refractive-index measurement of multilayered media or liquids.
Combining the confocal effect and laser frequency-shifted feedback, here a new method for refractive-index measurement is presented, which is noncontact, highly sensitive, and can accommodate multilayered media and liquids. In this method, the sample is scanned by a laser-frequency-shifted feedback confocal microscope along the optical axis, and the interfaces generated by different refractive indices correspond to the peaks of the scanning curve. Then the optical thickness is calculated with the known stage movement between the two peaks, and ray analysis. Finally, the ratio of the optical thickness to the physical thickness is used to calculate the refractive index. Compared to conventional methods, this technique is more compact and has less difficulty with sample processing. In particular, the laser-frequency-shifted feedback confocal microscope is extremely sensitive, and the amplification coefficient provided by laser feedback technology can reach 106, which means that this method can measure the refractive indices of multilayered media with very low refractive-index differences. Thus it is a promising technique for refractive-index measurement.
II. EXPERIMENTAL SETUP AND PRINCIPLE
2.1. Laser Frequency-shifted Feedback Confocal Microscope
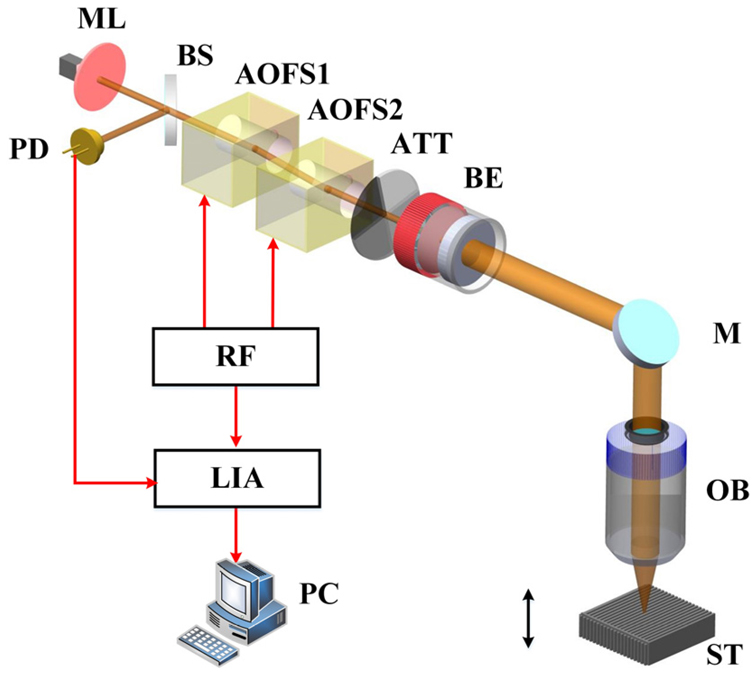
The system configuration of the laser frequency-shifted feedback confocal microscope is shown in Fig. 1. The
After that, the measuring light is expanded by a beam expander (BE) with an expanding ratio of 10, then focused by a 50× near-infrared objective lens (OB). Specifically, the OB with a numerical aperture (NA) of 0.42 has a long working distance, up to 20.4 mm, for large-scale scanning. A three-dimensional precision stage (XWJ-R, SYMC) is used to scan the sample. It should be noted that there exists a conjugate relationship between the focal point of the OB and the laser-beam waist: The beam waist acts as the equivalent of a spatial pinhole filter, approximately 26 μm in diameter.
The light reflected from the sample returns to the cavity via the original path. In this process, the light has undergone two frequency shifts, causing a total frequency shift of the laser of 2Ω=2MHz. The measurement signal transferred from the PD and the reference signal generated by the mixer are simultaneously input to a lock-in amplifier (LIA) (HF2LI, Zurich Instruments). Finally the LIA demodulates the measurement signal at 2Ω. According to the rate-equation model and confocal effect, the power modulation of laser-frequency-shifted confocal tomography is given by [27, 28]
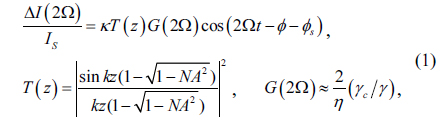
where Δ
The amplification coefficient
2.2. Principle of Refractive-index Measurement
We obtained measurements of the refractive indices of single plain glass and multilayered materials, using the laser-frequency-shifted feedback confocal microscope to track the shift in focal length shift that results from translating the focus along the optical axis within a material of different refractive index. Through analysis of the focused ray after entering the non-air medium, we determined the specific incident angle corresponding to the peak value of the scanning curve, and eliminated the influence of monochromatic aberration. Compared to conventional techniques, this method is more sensitive, more convenient, and has less difficulty in sample processing.
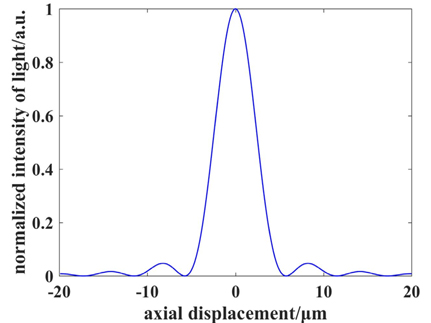
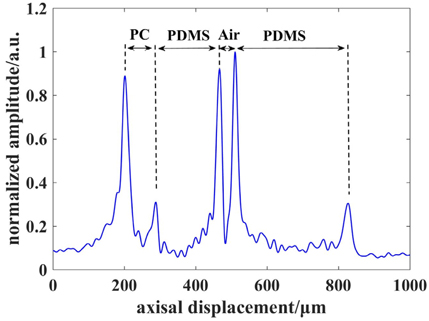
The measurement information comes directly from the axial scan, or indirectly from the tomographic image. During vertical scanning, the laser beam focused by OB is regarded as an optical probe passing through the measured sample. The detected time-domain signal waveform can be represented by Eq. (1), and the envelope of this signal that is demodulated by the LIA (namely, the defocusing curve) is shown in Fig. 2. The peak position of the defocusing curve corresponds exactly to the focus of the optical probe; when the focus of the optical probe touches the sample’s surface or an interface, the curve can reach its peak value.
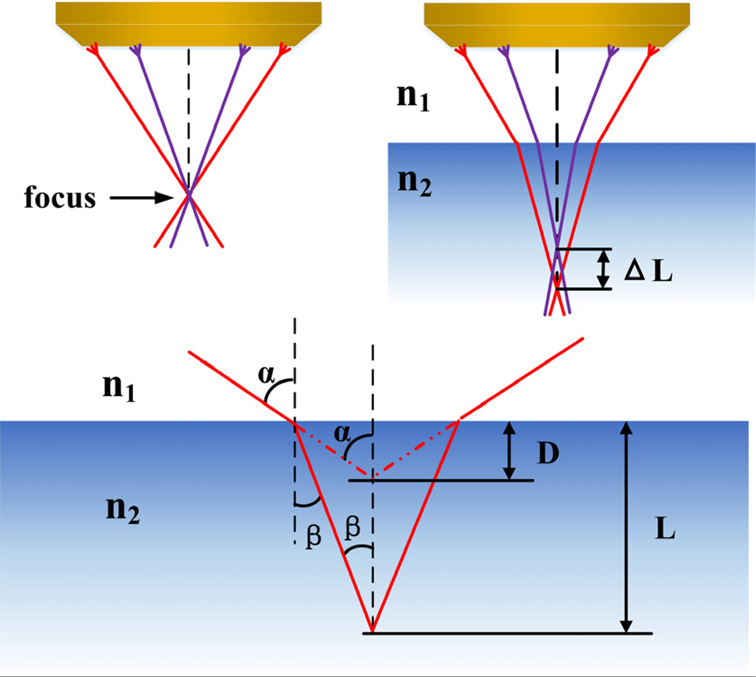
Of particular note is that all light emitted from the objective lens in the air converges in focus, but monochromatic aberration along the optical axis will be produced, and the actual focus will move after the optical probe penetrates the sample, due to the change in refractive index. This process is shown in Fig. 3. The refractive index of the media on both sides of the interface are n1 and n2. The incident and refracted angles of the light are
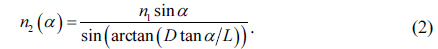
The refractive index n2 is rel to the incidence angle
The relationship between light intensity and incidence angle can be shown as

in which

The function relating light intensity and

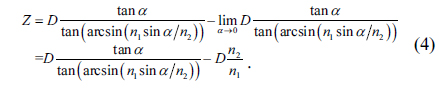
After that, the extremum of this defocusing curve is obtained:

The peak is acquired at Combined with Eq. (4), the result for the angle corresponding to the maximum is
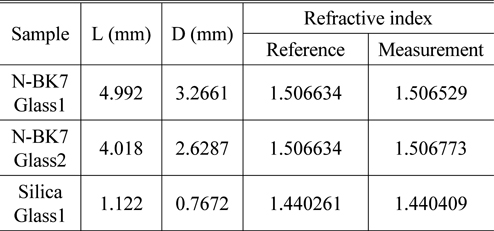
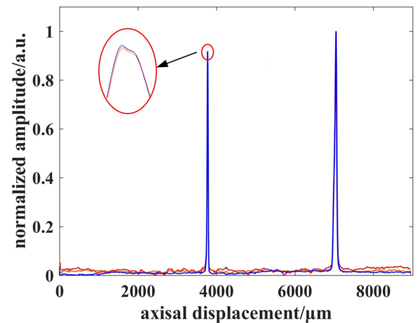
In the experiment, N-BK7 glass and Silica glass with two parallel surfaces are used as samples; the scanning curve for N-BK7 glass is shown in Fig. 4. The refractive index of air is 1.0003, as calculated by the Edlen equation [29], and the reference refractive indices of the samples are derived from the interpolation formula of the ZEMAX software. The actual thickness of the sample is found by micrometer with an uncertainty of 1 μm, each sample being measured 10 times in this experiment; the average of the results is regarded as the parameter L. The parameter D is measured as the interval between the peaks of the scanning curve, each sample again being measured 10 times. After that, the refractive index can be acquired by substituting the values for D, L, and
[TABLE 1.] Refractive index measurement of N-BK7 and silica plain glass

Refractive index measurement of N-BK7 and silica plain glass
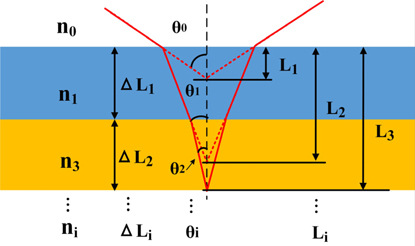
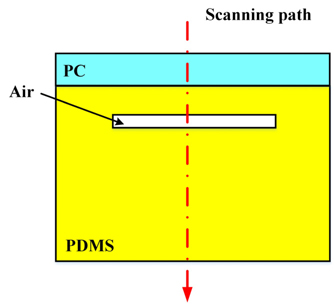
The refractive indices of multilayered media are measured in the next experiment. The conditions of an optical probe in a multilayered medium are shown in Fig. 5, where the refractive indices, inciden angle, and distance from the first surface to the focus of the incident ray for each layer are
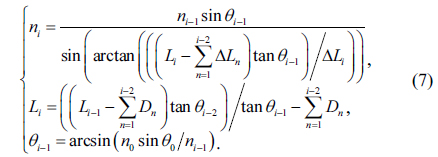
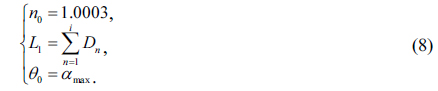
The initial condition of the recursion formula is

in which the peak separation in the scanning curve and the physical thickness of layer
Finally, the refractive index of each layer can be calculated using Eqs. (7) and (8); the results are shown in Table 2. The experimental results are in agreement with the reference values given by the manufacturer. The differences between them are less than 0.005, and the stability of refractive index is better than 0.0006. The error of the refractive-index measurement is mainly caused by the imprecise physical thickness, which comes from the design dimensions. If the error in corresponding physical thickness were less than 1 μm, the corresponding uncertainty in refractive index would be less than 0.0021. Moreover, the positional-defocusing curve’s peak influences the results of the experiment. The uncertainty in refractive index could be less than 0.003, if the positioning accuracy were better than 1 μm. In the experiment, the positioning accuracy of the stage is better than 1 μm, and the measurements above all indicate that the new method for refractive-index measurement of multilayered media with the laser-frequency-shifted feedback confocal microscope is effective and reliable.
[TABLE 2.] Refractive-index measurements for the microfluidic chip
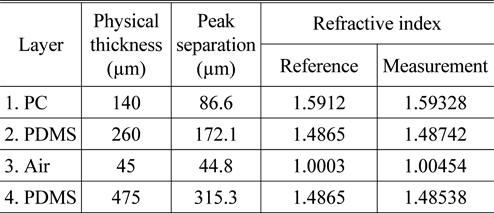
Refractive-index measurements for the microfluidic chip
In conclusion, we present a new method to measure the refractive index of single plain glass or multilayered material based on the laser frequency-shifted confocal feedback microscope. Combining the laser frequency-shift feedback technique and the confocal effect, the method can obtain high axial-positioning accuracy and sensitivity. The N-BK7 glass and Silica plain glass serve as samples, and their measured refractive indices are 1.5065 and 1.4404 respectively. According to the measured results for N-BK7 glass and Silica plain glass, the measurement uncertainty in refractive index is less than 0.001. After scanning a microfluidic chip with four layers and calculating the refractive index of each layer with a recursion formula, the feasibility of this method for multilayered materials is tested. The measured refractive indices of the PDMS layer and PC layers are 1.5932 and 1.4874 respectively, and the measurement uncertainty in refractive index is better than 0.005.
Compared to conventional methods, our system is more compact and has less difficulty in sample processing, and thus can be utilized in many settings, such as an ordinary laboratory or industry. In this work, the refractive indices of single plain glass and multilayered materials are measured at 1064 nm, which is significant for the manufacture of near-infrared optical materials. Furthermore, the presented method can be further used to measure the refractive index of a liquid, by using a microfluidic chip whose design dimensions are accurately known.