In order to meet stringent future emission regulations from the environmental protection agency (EPA), especially with respect to reducing nitrogen oxides (NOx), various technologies such as basic internal engine modifications, fuel switching, direct water injection, exhaust gas recirculation (EGR), and selective catalytic reduction (SCR) have been recommended for marine diesel engines. The international maritime organization (IMO) has regulated NOx emissions from marine vessels. The IMO’s Tier III standard requires that marine vessels must reduce NOx emissions by 80% between 2010 and 2016 (DieselNet, 2008). SCR is one of the most promising technologies for accomplishing this aggressive regulation. As a reducing agent, urea is preferred in marine SCR applications because of its safety and low toxicity. Urea water solution (UWS), containing 32.5
Flow mixing is a common device unit operation in a large number of processes, and it is used in many different applications where a defined degree of homogeneity of a fluid is desired (Regner et al., 2006). In particular, a mixing device, e.g., a static mixer is usually installed to improve the rate of decomposition for urea to NH3 and to enhance the uniformity of the spatial distribution of NH3 and isocyanic acid (HNCO) (Munnannur and Liu, 2010). However, the increase in the system pressure drop because of mixing must be minimized.
There have been many attempts to develop static mixers for mobile SCR applications, and computational fluid dynamics (CFD) has been widely used in the design optimization of spray nozzles, flow mixing characteristics, NOx reduction processes, and urea decomposition (Thakur et al., 2003; Zheng et al., 2009; Zheng et al., 2010; Zhang et al., 2006; Zhang and Romzek, 2007; Birkhold et al., 2007; Nguyen et al., 2010; Larmi and Tiainen, 2003; Chen and Williams, 2005; Battoei et al., 2006). Thakur et al. (2003) provided an extensive review of static mixers in the processing industry, presenting guidelines for the selection of static mixers. Zheng et al. (2009) developed several types of mixers, including cone, 2-stage, and butterfly mixers. They also investigated the effect of in-pipe mixing devices on urea deposits with respect to mixer configurations and various exhaust gas temperatures. Zhang et al. (2006) introduced a simple flow mixer with twisted blades based on an original delta wing mixer for the purpose of creating both swirling and turbulent flows. Turbulent flow has a dominant effect on the flow mixing index or uniformity index in the short distance immediately behind the flow mixer (Zhang et al., 2006; Zhang and Romzek, 2007).
In allowing a sufficient mixing length by reducing the occupied space, it is necessary to develop a proper static mixer with a high mixing performance as well as a low pressure drop. However, there is insufficient research on the relationship between flow mixing characteristics and pressure drops in the marine engine fields.
In this study, both line- and swirl-type mixers were considered; each mixer was divided into three cases of vane angles: 30º, 45º, and 60º. The effects of a mixer’s geometric structure on the flow mixing characteristics and the resulting pressure drop were investigated numerically using a commercial finite volume, three-dimensional (3-D) CFD code; FLUENT (version 6.3.26). The purpose of this study was to evaluate the effect of mixer geometry on the relative intensity, uniformity index, and pressure drop with the objective of enhancing the de-NOx efficiency. Additionally, information pertaining to the selection of proper static mixers was provided based on the correlation between the uniformity index and the pressure drop.
NUMERICAL METHODS AND CONDITIONS
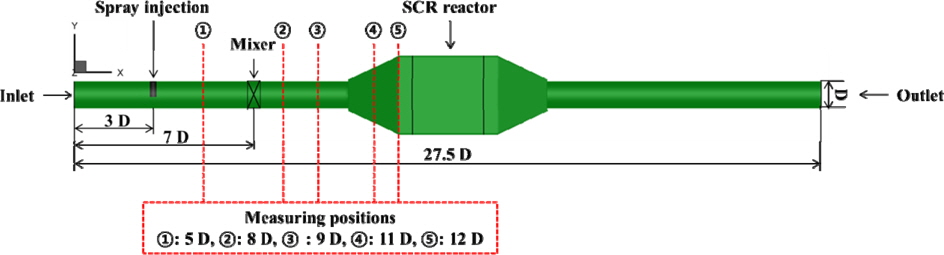
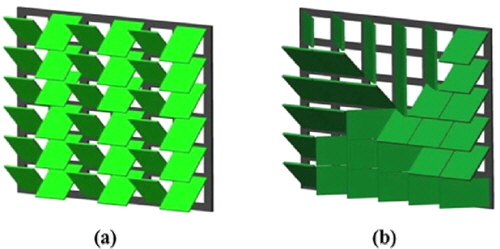
The geometry of the SCR system, which includes the position of the spray injector, mixer, SCR reactor, and measuring points, is shown in Fig. 1. Line-type and swirl-type mixers, as shown in Fig. 2, have 36 vanes each. A swirl-type mixer was developed in this study with several unique features: a simple design for production; a variable vane angle to generate different swirl flows; and the flexibility for installation and to control the mixer volume in the pipe. Both types of mixers with various vane angles were simulated in 3-D to investigate the flow pattern, turbulence characteristics, and uniformity of water, which is assumed to be UWS at the SCR catalyst entrance.
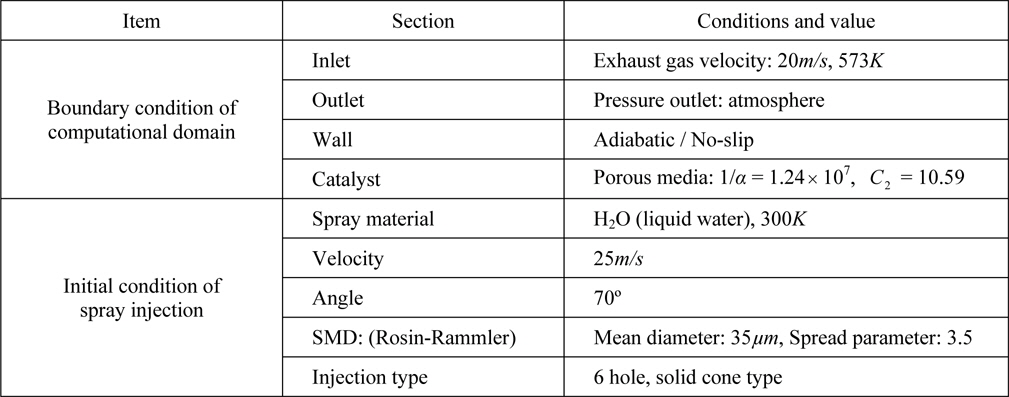
The test conditions are listed in Table 1. The computational grid is composed of approximately 650,000 hexahedral and tetrahedral cells using FLUENT/GAMBIT (ANSYS, Inc., USA). The mesh structure became denser toward the spray injector and the mixer because of the high gradients of velocity, temperature, and species concentrations.
[Table 1] Computational conditions with various mixer types and positions.
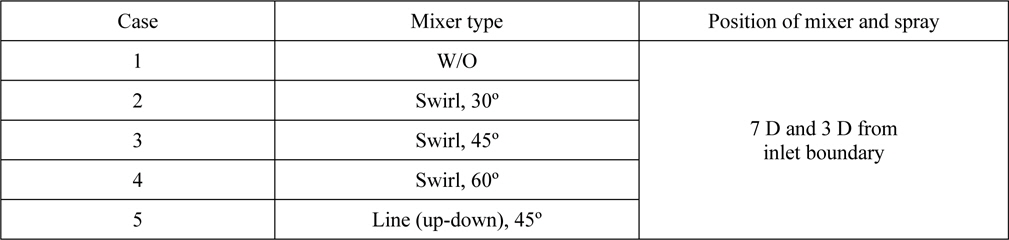
Computational conditions with various mixer types and positions.
The model assumes that the exhaust gas is fully developed and it consists of 77% N2 and 23% O2 by mass. A time step of 1
[Table 2] Summary of initial and boundary conditions.

Summary of initial and boundary conditions.
The flow region in the SCR system is divided into three regions: the 1st region is the turbulent flow region in the upstream and downstream of the SCR reactor; the 2nd region is the laminar flow region in the SCR reactor; and the 3rd region is the region that contains the dispersed two-phase flow in the surrounding spray injector. The Lagrangian discrete phase model is used which contains sub-models for droplet dispersion, drag, and evaporation. An injection type of solid cone for primary breakup model is used to inject water liquid. To minimize computational time and stable convergence strategy, secondary breakup model for droplet breakup and collision are not considered in this study. The injected drop-size was found to follow a RossinRammler distribution with a mean diameter of 35 microns and spread parameter of 3.5. For an incompressible, unsteady twophase turbulent flow, the 3-D Reynolds-averaged Navier-Stokes (RANS) governing equations for mass, momentum, species concentration, and energy were solved. The standard


The turbulent kinetic energy


In the above equations, the coefficients are as follows: Cε1=1.44, Cε2=1.92, Cµ=0.09, σκ=1.0, and σε=1.3.
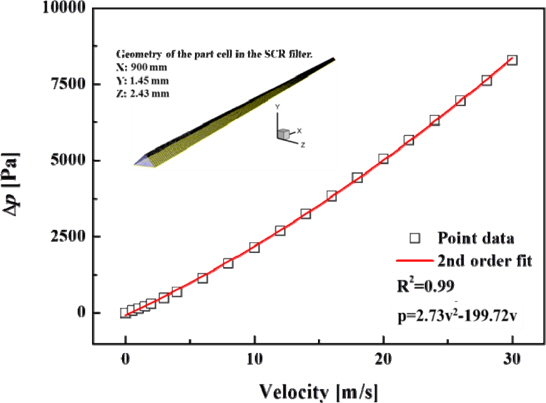
The catalyst is the core of SCR reactor. In this study, a honeycomb type SCR catalyst filter was adopted. If the catalyst filter is constructed physically from a numerical simulation without any simplifications, the grid of the model will reach a level that is beyond the calculation capabilities of most computing systems. Therefore, an approach of a porous media model was adopted to simulate the flow in the catalyst filter. The mass and momentum transfer in the radial direction was ignored because the axial velocity is dominant in the SCR filter (Jeong et al., 2005). In this simple model, the pressure change (drop) is defined by a combination of Darcy’s Law and an additional inertial loss term along the SCR filter (Fluent, 2007):


where ∆
>
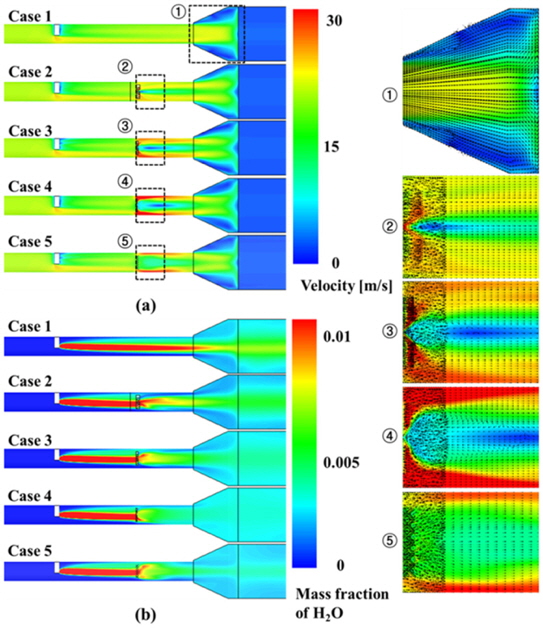
Distributions of velocity and water mass fraction in SCR system
Fig. 4 illustrates the contours of the velocity and water concentration of parts of the SCR system, including the spray injector, mixer, and reactor. Case 1 represents the calculation conditions of no mixer. Cases 2, 3, and 4 represent the calculation conditions of swirl-type mixers with vane angles of 30º, 45º, and 60º, respectively. Case 5 represents the calculation conditions of a line-type mixer with a vane angle of 45º. Considerable disturbances occur surround the spray injector for all cases. The flow patterns behind the mixers differ with the mixer type. In the swirl-type mixers of cases 2, 3, and 4, the central recirculation zone (CRZ) is generated near the mixer fields, and the CRZ increases with increasing vane angle. The line-type mixer, however, does not exhibit a CRZ, because the main flow near the mixer moves up and down. The velocity distribution and water concentration of case 1 in front of the SCR reactor are concentrated in the center region. This phenomenon may promote serious problems, such as catalyst filter damage and NH3 slip (NMRI, 2011). For the remainder of the cases (cases 2-5), the velocity and concentration of water are relatively well distributed in comparison to case 1. In particular, Fig. 4(b) demonstrates that the mass fraction of water for case 3 appears well mixed with input gases in front of the SCR reactor. Based on these results, NH3 slip, low mixing of UWS with hot exhaust gases, and catalyst filer damage in front of the SCR reactor have the potential to be mitigated without using any guide vanes, such as baffles.
>
Effect of mixer geometry on turbulent flow characteristics
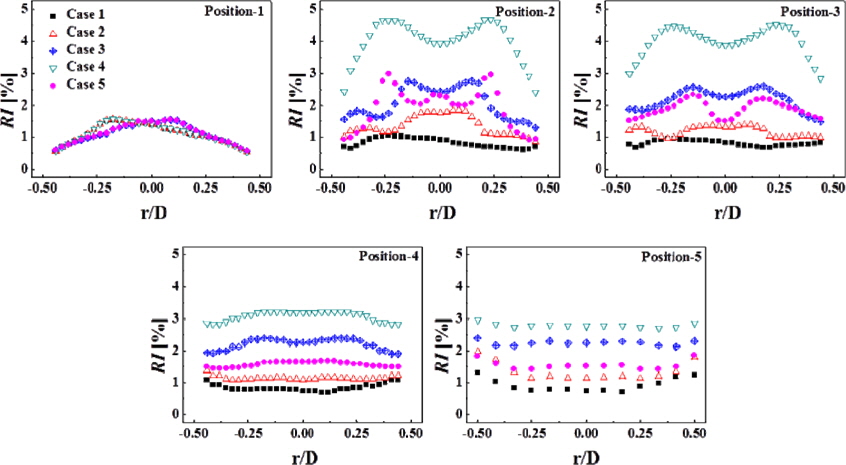
Turbulent flow occurs when instabilities in a flow are not sufficiently damped by viscous action and the fluid velocity at each point in the flow exhibits random fluctuations (Turns, 2000). Turbulence can be depicted as fluctuations in a fluid flow. When working with chemicals as in an SCR reactor, typically a high level of flow fluctuations is preferable for the mixing of UWS with exhaust gases. It is common to define the relative turbulent intensity for the velocity as follows:

where
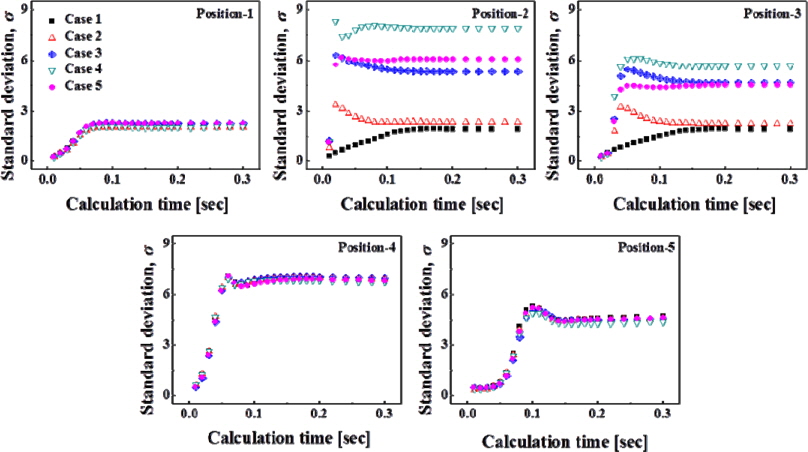
Fig. 5 shows

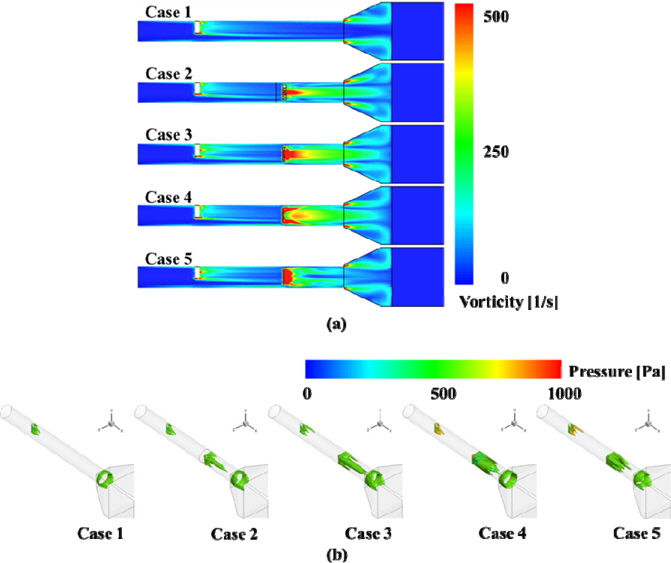
Fig. 6 shows the contours of the vorticity magnitude and the iso-surface of the vorticity magnitude for all cases. Except for case 1, the other cases exhibit a high vorticity magnitude regardless of the mixer type. This is because the introduced flow is concentrated at the center region for the case 1, while the line-type and swirl-type models disperse the flow to the wall. For case 5 (line-type mixer), the vorticity magnitude was relatively high by the turbulent flow immediately behind the mixer. A small-scale vortex may be generated directly behind the mixer, and vanishes rapidly after passing through it. For the swirltype mixers, the vorticity magnitude is longer with stream-wise axis than that for the line-type mixer. In addition, the volume of the vorticity as shown in Fig. 6 increases because the CRZ gradually increases with the vane angle. The results above indicate that the size and length of the CRZ are controlled by the mixer shape. The swirl-type mixer creates both turbulent and swirling flows. Therefore, it is important to select the appropriate mixer in order to maximize flow mixing and minimize NH3 slip. The reaction for NOx reduction in SCR catalysts requires a sufficient reaction time within a certain temperature range. The NO and the NH3 do not react at lower temperatures and insufficient flow mixing. NH3 slip is a means of NH3 passing through the SCR reactor un-reacted.
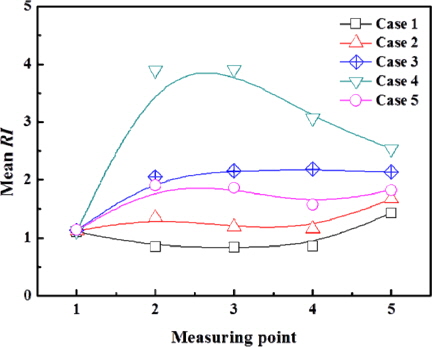
Fig. 7 presents relative intensity (
>
Relationship between pressure drop and uniform flow
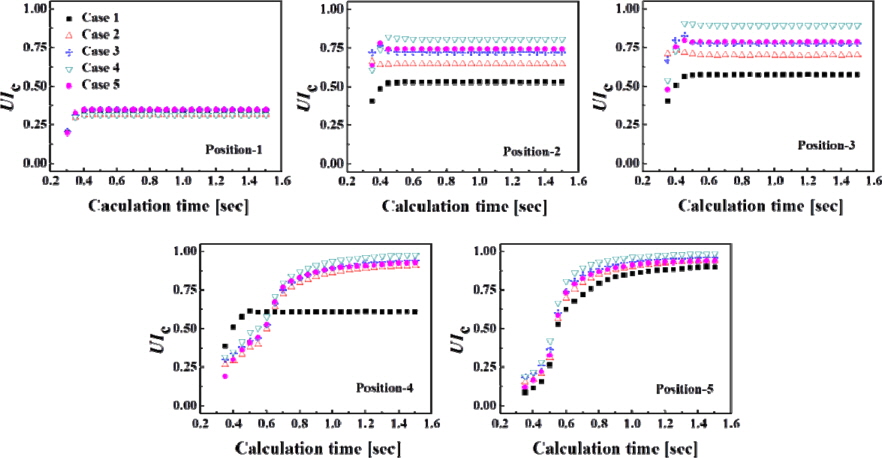
A uniform flow and UWS distribution across the front of the catalyst filter are necessary to obtain a maximum performance for de-NOx and a minimum NH3 slip in the SCR system. The flow uniformity index is a commonly used indicator of the flow distribution degree for after-treatment applications (Weltens et al., 1993; Bressler et al., 1996; Girard et al., 2006). In this study, a similar definition is adopted to evaluate the distribution degree of water concentration at a certain location along the pipe:

where,
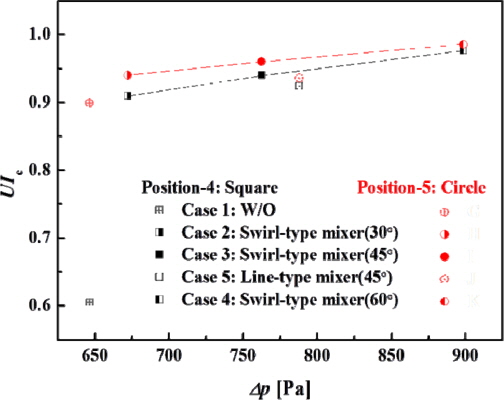
Fig. 9 shows the
Mixer development generally focuses on the high efficiency of NOx reduction because of its direct impact on the design target; however, it is difficult to determine the total performance of mixing devices based on only the
3-D numerical simulations were performed to investigate the effects of mixer geometry on the mixing performance and the pressure drop. Flow mixing and uniformity can be greatly improved by using a static mixer in the SCR system. Turbulent and swirling flows can also achieve a great improvement for flow mixing with respect to flow recirculation phenomena through a longer distance. In this study, information regarding the selection of proper static mixers was provided based on the correlation between the uniformity index and the pressure drop. The results show that the mixer for SCR applications can be effectively optimized by using a well-designed mixing device. The main results are summarized as follows: 1) In comparison to the case without a mixer, the cases with a mixer improve the uniformity index by approximately 20% directly behind the mixer, approximately 30% in the diffuser, and approximately 5% immediately in front of the mixer. 2) In the swirl-type mixer, the CRZ is generated directly behind the mixer, and increases with the vane angles of the mixer. Therefore, it is expected that the mixing region is longer with stream-wise axis because the swirl-type mixer creates turbulent and swirling flows. 3) The swirl-type mixer is more effective than the line-type mixer with respect to the enhancement of mixing performance, even though there is a tradeoff relationship between the uniformity index and the pressure drop. Therefore, the swirl-type mixer with a vane angle of 45º is the most suitable model in this study based on the results of both parameters.