Coastal beach erosions are occurring worldwide and have become a social issue. In South Korea, there are more than 200 places where such erosions are progressing. Addressing these erosion problems requires strategic approaches because they are so comprehensive and complex that they cannot be simply solved with a particular technology. Among strategic coastal beach maintenance technologies, the steel-type breakwater (STB) system is being spotlighted as a core element technology. It is considered a strategic technology that is applicable depending on the coastal situation, because it has a simple structure that consists of horizontal porous plates and piles and is easy to construct, demolish and reuse after its dissipater is simply removed as needed.
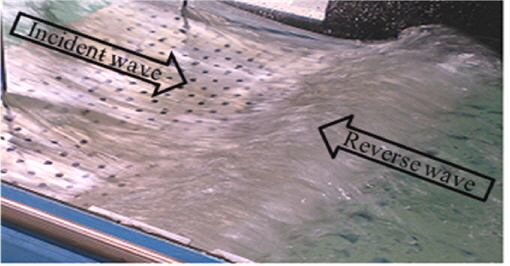
Many studies have been conducted on the porous horizontal plate. Some representative examples are the studies of Tuck (1975), Isaacson et al. (1998), Cho and Kim (1998) and Cho (2002). A typical study on the wave blockage effects of the seaward reverse wave under a submerged solid plate was that of Graw (1992), and it could be used as a wave energy converter (Graw, 1993). Moreover, Kee et al. (2007) observed with their naked eyes that the complicated waves that collided over the plate between incident waves and reverse waves were generated by the vortex at the edges, and that the jet flows proceed and stimulate the wave breaks into higher harmonics. Wave reflection can be occurred by the diffraction at the edges of submerged plate.
However, most previous studies were focused on the hydraulic characteristics of the horizontal plate, and only a few studies dwelt on the methods/methodologies that could reasonably estimate the design wave forces in view of the horizontal plate as a structure. The design methodologies and real sea verification experiments of the STB were studied by Kweon et al. (2008; 2011), Kwon et al. (2011), Lee et al. (2011), Kweon et al. (2011) and Kweon et al. (2012). In particular, a methodology for determining the uplift force that acts vertically on the horizontal plate to estimate the design drag force of the pile was proposed by Kweon et al. (2011). On the other hand, Kweon et al. (2013) compared and analyzed the design methodologies for the wave force estimations and confirmed that “the wave force value to which an integral of the maximum uplift force was applied at each measurement point due to the regular wave that corresponds to the design significant wave was usable as the design drag force of the pile,” as proposed by Kweon et al. (2011). However, Kweon et al. (2013) analyzed the external design force estimation of the uplift force that acted on the plate without describing in detail the trends in the wave pressures that were affected by the water level rise over the horizontal plate due to the collisions between the propagating waves and the seaward reverse waves.
When the reverse wave occurs toward weather side, it collides with an incident wave. That causes the partial standing wave with the highest surface elevation occurring on a lee part of the dual plate. It means that the biggest difference of the wave surface elevation between in front and rear part takes place. In addition, torsion analysis of the dual plate is required for a real sea application. For the required analysis, the separation information of the wave pressure acting on the upper and lower part of a plate should be available. However, the potential theory could separate the wave pressure on a plate not on time level but frequency domain. The analysis based on the Navier-Stokes equation has a difficulty in full duration time of the random wave even neglecting friction treatment.
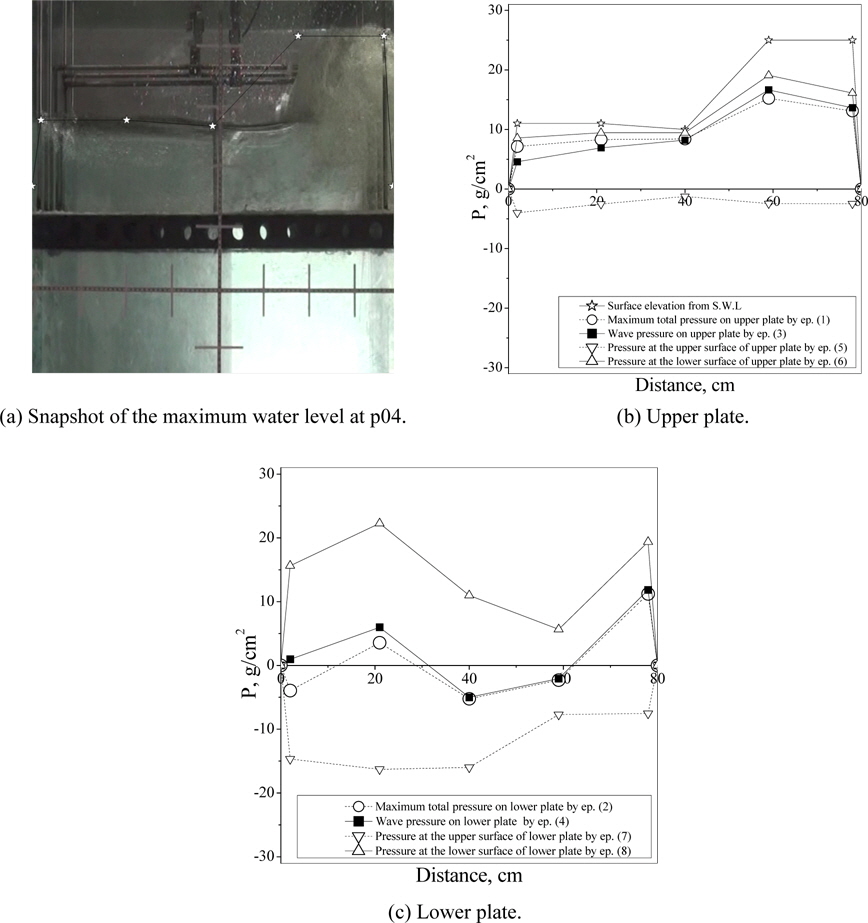
Fig. 1 shows an instant image of the phenomenon that the reverse waves and the propagating waves collide and repulse over the dual porous horizontal plate.
Therefore, this study measured the wave pressures that acted on each area point on the dual porous horizontal plate, and investigated the characteristics of the wave pressures that acted on the porous horizontal plate on the occurrence of seaward reverse waves that contributed to the wave reflections.
EXPERIMENTAL CROSS-SECTION AND EXPERIMENTAL WAVE CONDITIONS
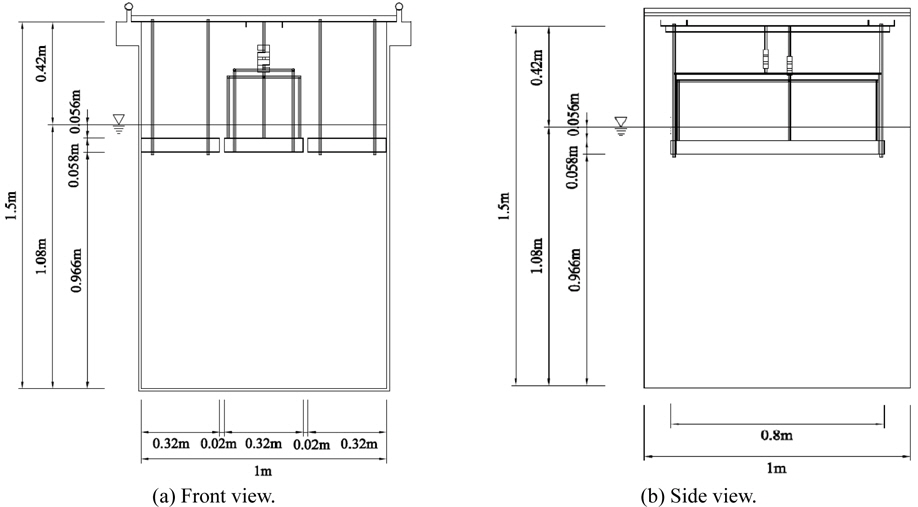
This study conducted a 1/25-scale hydraulic model test of the dual porous horizontal plate with a unidirectional wave flume. Fig. 2 shows the experimental cross-section of the test. The experiment was conducted with both regular waves and random waves acting on the upper and lower plates, with a porous rate of 7%. The waves that were used in the test were six types of regular waves and four types of random waves. The random waves were assigned a value of 3.3, which represented the peak amplification ratio of the JONSWAP spectrum. The incident waves for the experiment were selected so that the wave steepness (
[Table 1.] Experimental wave conditions.
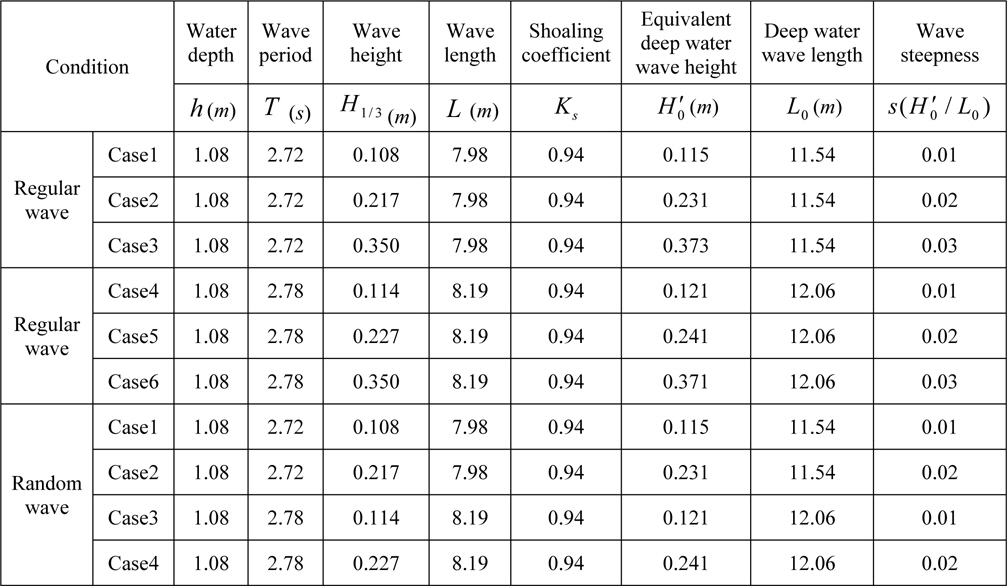
Experimental wave conditions.
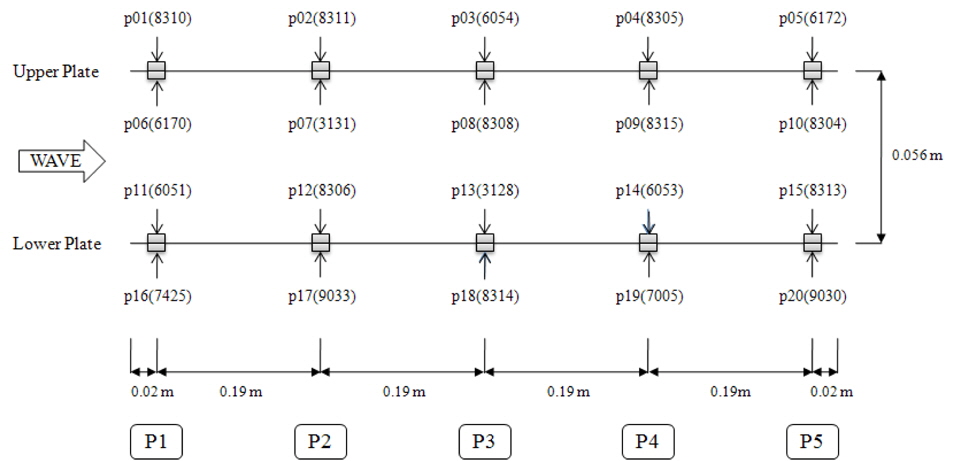
The wave gauges were installed parallel to the wave propagation direction at equal intervals, and five gauges were installed on the same extension line of each of the upper and lower surfaces of two horizontal plates, for a total of 20 gauges. The first gauge was installed 2
As shown in Fig. 3, the positive value of the upper gauge means compression but negative one presents drag pressure. When the upper part gauge and lower one presents positive values, they mean compression pressure acting on the plate. Reversely that presents drag pressure.
ANALYSIS OF THE PHASE DIFFERENCES BY MEASURING THE WAVE PRESSURE
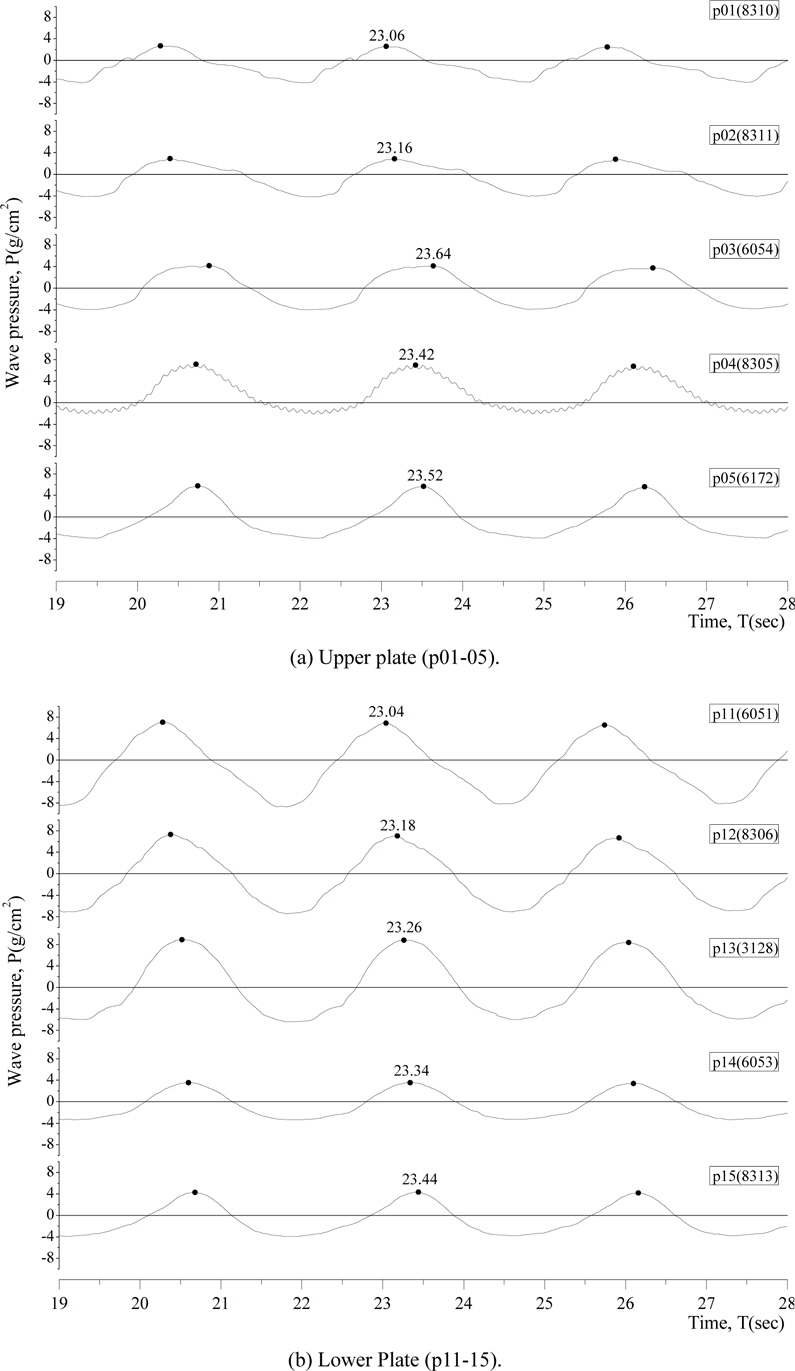
The phase differences may occur according to the time series of the wave pressures because the seaward reverse waves that are generated on the horizontal plate disturb the propagating waves. To verify the influence of such disturbance, in this study, the phase differences were compared through the time series of the wave pressures that acted on each measurement point.
In all the cases, it was observed with the naked eyes that the seaward reverse waves increased the water level to the maximum at the upper part of the p04 point of the P4 series that was located at the lee side of the horizontal plate. This phenomenon is considered to be caused by the creation of the reflected waves while they are colliding with the propagating waves, and such reflected waves simultaneously affect the phases of the propagating waves. This analysis investigates how the seaward reverse waves that retrogress against the wave propagation direction affect the phases of the peak wave pressures. Fig. 4 shows the phase differences of the wave pressures that were measured in Case 1 with the regular wave. The subject data were compared at the time when they were considered stationary.
Fig. 4(a) shows that the second group phases at five measurement points presented slower peak pressure phases at point p03 than at points p04 and p05. Furthermore, the phase at point p04 was faster, even though p05 should be faster in that phase because the seaward reverse waves occurred toward the direction opposite that of the propagating waves. This is considered to be because the water level at p04 increased due to the repeated waves and streams, and the collisions toward the opposite direction produced totally contradictory phases that were faster than the propagating waves and the stream orders toward the opposite direction. In this study, such phase change was named the “reverse phase.” That is, as the waves were affected by the streams, and the streams, by the waves, the phases became faster at points p04, 05 and 03, in that order, among points p03-05. However, such reverse phase phenomena were not observed in the lower plate, as shown in Fig. 2(b). Moreover, the collisions between the coming waves (the propagating waves) and the seaward reverse water streams made the water level unstable and caused a trembling phenomenon.
Such reverse phase phenomena were observed at p04 or p05 on the upper plate not only in Cases 1, 2 and 3 with the regular waves, but also in Cases 1 and 2 with the random waves as shown in Table 2. However, they were not observed on the lower plate. Table 2 shows the arrival time of the peak pressure at each point.
[Table 2] Relative phase of arrival time of the pressure crest at each measuring point.
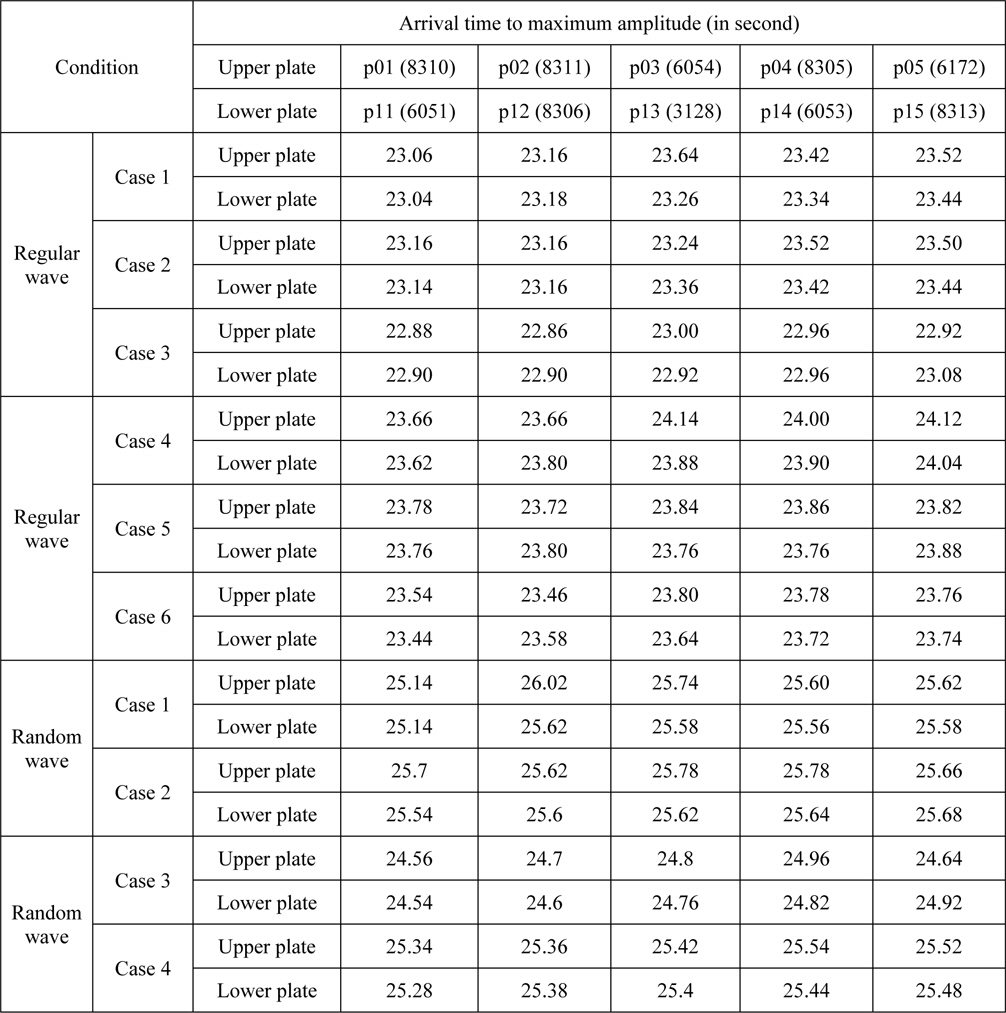
Relative phase of arrival time of the pressure crest at each measuring point.
CHARACTERISTIC ANALYSIS OF THE WAVE PRESSURE DISTRIBUTION
The wave pressures act on both sides of the horizontal plate, while the water level rise caused by the reverse wave acts mainly towards the gravity direction. The two sides are separated, compared, and analyzed in order to investigate how the wave pressures caused by the reverse wave act on the upper and lower plates. Further, the difference between the acting wave pressures generated by the reverse wave and the maximum momentary wave pressure distributions acting on the entire surface of the plate is examined. First, to investigate the difference between the reverse wave loads and the maximum loads acting on the horizontal plate, the pressure distributions acting on both upper and lower plates are analyzed when the maximum wave pressures act on the entire upper plate. Second, the wave pressures acting on the upper and lower plates are analyzed when the wave pressures peak to the maximum at the point p04. Finally, to understand whether the load and the increase of the water level caused by the reverse wave only acts towards the gravity directions, the wave pressures acting on the upper and lower surfaces of horizontal plate are separated.
The analyses were conducted using three different methods, and their results were compared. The first method analyzed the wave pressure distribution when the aggregate of five points became the maximum after the upper and lower wave pressures at each point of the upper plate were added up. At this point, comparisons were made on the wave pressure distributions on the lower plate with those on the upper plate in the same time slots when the wave pressures peaked to the maximum. This can be expressed as Eq. (1), which corresponds to the case wherein the total pressure that acted on the upper plate reached the maximum among the time series.


wherein
The second method analyzed the wave pressure distributions that acted on the plate at an arbitrary time


wherein, the bottom subscript
The third and last method analyzed the wave pressure distributions as shown in Eq. (5) in the following, after separating the wave pressure data in the Eqs. (3) and (4) by the upper and lower surfaces.


wherein, the bottom subscript
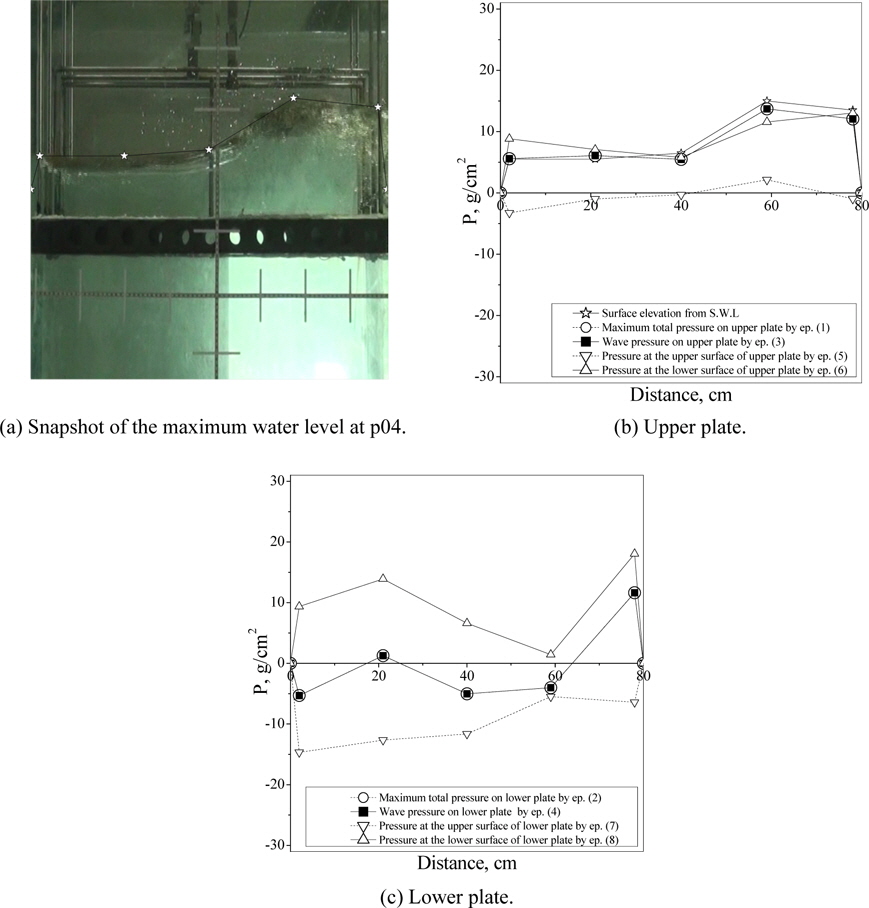
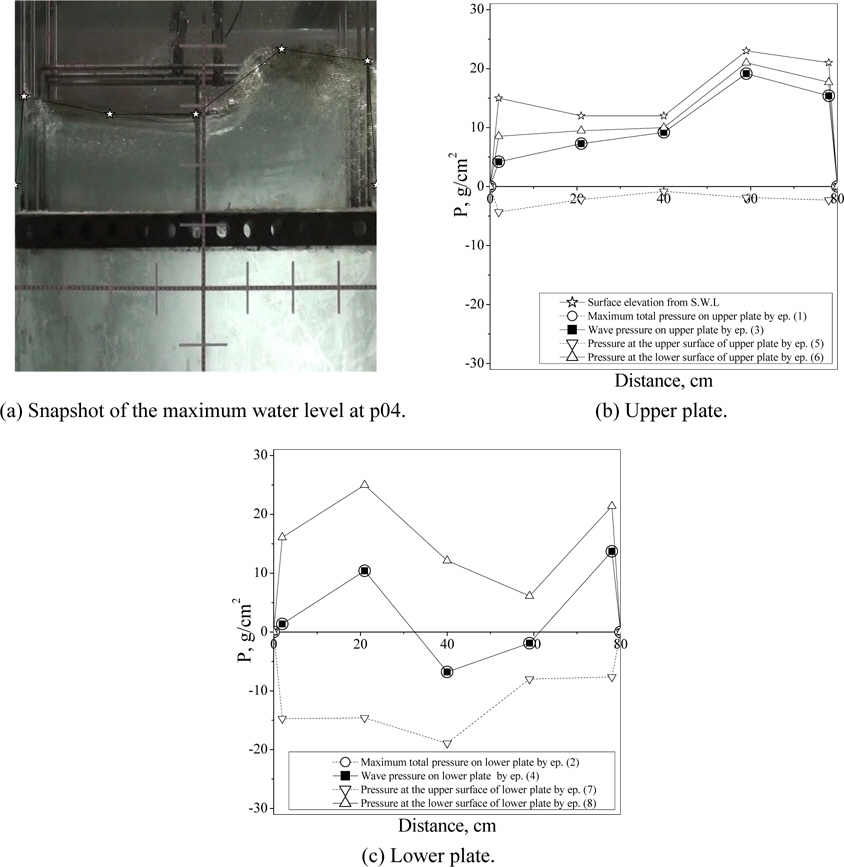
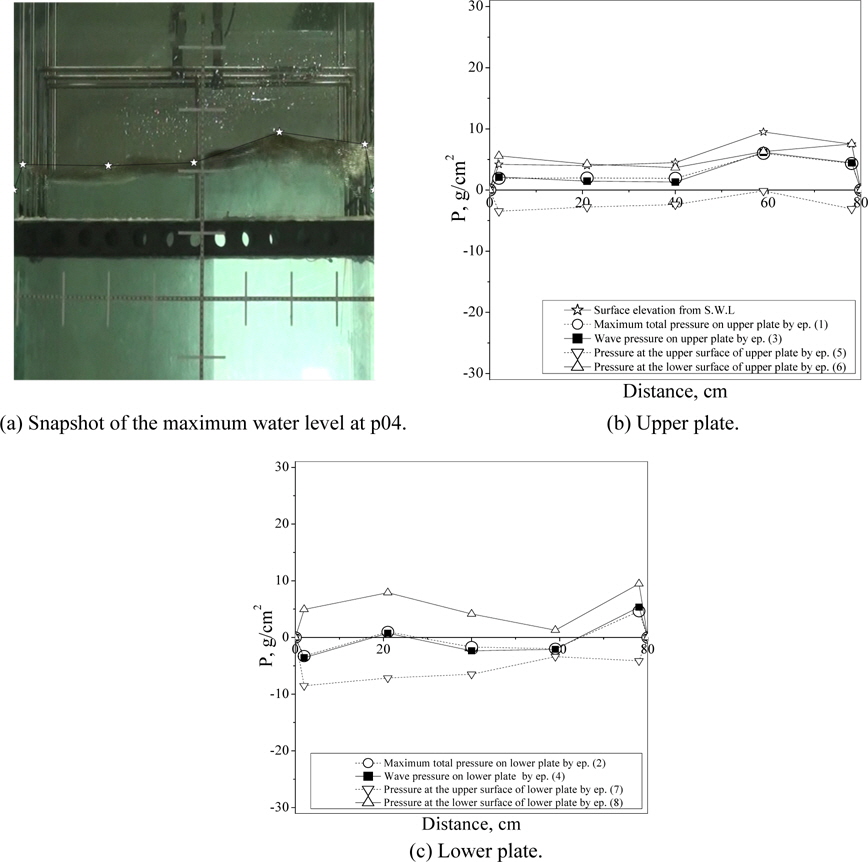
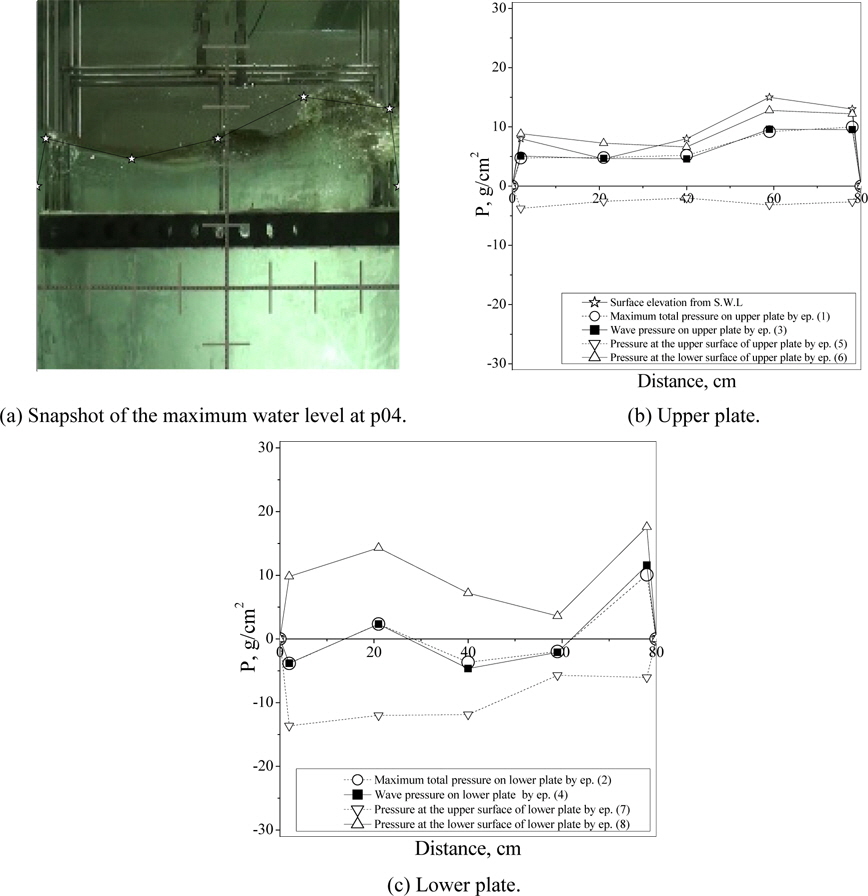
To understand the characteristics of the wave pressure distributions that acted at the moment when the seaward reverse waves became significant, the wave pressures that acted on the upper and lower plates at the same time separately were compared. As for the analysis results, the moments when the maximum water level occurred at p04 were caught in the video and the wave pressures that acted on the upper and lower plates were marked as the upper surface, the lower surface and the aggregate of both surfaces and were compared. At this point, the water levels that were caught momentarily in the photos were considered the normal water pressures of the streams and were compared.
The experiment subjects in Case 3 with the regular wave and in Case 2 with the random wave were compared according to the analysis method Eqs. (1)-(8). The vertical axes 0 in Figs. 5-9 refer to the still water level, and the horizontal axes, to the width and length of the horizontal plate. Moreover, the water level heights at the still water levels were based on the upper parts of the wave breakers.
As shown in Figs. 5-9, the aggregate forces that acted on the upper plate, according to Eq. (3), were larger than those that acted on the lower plate, according to Eq. (4). Moreover, while the wave pressures acted toward the gravity direction on the upper plate, the wave pressures acted toward the gravity or anti-gravity directions at each point on the lower plate. Also, when the wave pressures at the upper and lower plates were separated into the wave pressures that acted on the upper and lower surfaces, respectively, it was understood that the tensile forces were mostly acting. The difference between Eqs. (5) and (6) was smaller than that between Eqs. (7) and (8), which means that the tensile force that acted on the lower plate was larger than that which acted on the upper plate.
As marked in Eqs. (1) and (2), the wave pressure distributions of the total momentary wave pressures at each point almost coincided with the wave distributions at the moments when the seaward reverse waves were significant. Therefore, the seaward reverse waves seem to have produced the maximum momentary wave forces on the porous horizontal plate. Such phenomena appeared equally with the regular waves and the random waves. Moreover, the wave pressure distributions on the upper plate appeared similar to the water level distributions that were caused by the seaward reverse waves, but the wave pressure that acted on the lower plate toward the gravity direction differed from that toward the anti-gravity direction. As shown in the calculations using Eq. (4), the wave pressures that acted on the lower plate fell far short of those of the surface waves but acted equally, largely at 80cm-distant points in all the cases. Moreover, Figs. 6 and 8 show that as the wave steepness became larger, the wave pressures that acted on the lower plate grew toward the gravity direction at a 20cm-distant point that corresponded to the front weather side equally either with the regular waves or the random waves. And, as shown in Fig. 4(a), the wave pressure appeared the largest at p04. However, the lower plate showed relatively lower wave pressures at p14 which was positioned at the same propagating position as p04 (at the same alignment of P4). Such trends at the measuring points p04 and p14 were also found in all Cases.
>
Active characteristics of compression wave pressures and wave drag pressures
As mentioned in the previous section, each wave pressure acting on the upper and lower surfaces of the upper and lower plates according to the Eqs. (5)-(8) showed that the drag forces caused by the reverse wave act on the upper plate as shown in Figs. 5-9. Moreover, the drag forces appeared to have acted identically on the lower plate. And, the wave drag pressures that acted on the lower plate were found to have been greater than those that acted on the upper plate. Therefore, it must be verified if such characteristics occur due to the reverse waves only, because such characteristics can provide important information for the selection of the plate material and for the analysis of the material torsions.
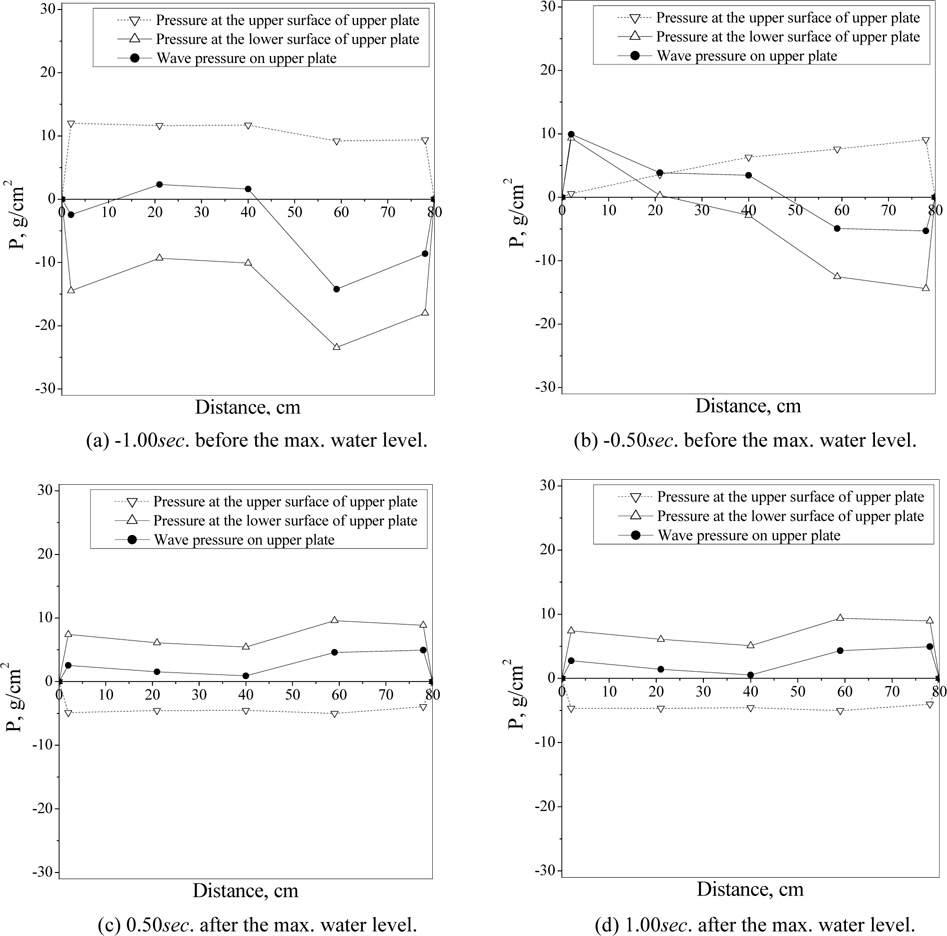
In this study, it was investigated if the compression wave pressures or wave drag pressures affected the plates at other times and if the wave drag pressures act identically on the upper and lower plates when the water level caused by the reverse waves rises to the maximum. Also, to investigate the characteristics of the wave pressures that act on the horizontal plate according to time changes, the characteristics of wave pressure distributions before and after the time when the maximum wave pressures act at p04 on the upper plate were examined. To abstract the wave pressure distribution data, the time when the water level reached the maximum at p04 was set at 0
Fig. 10 shows the wave pressure distributions that appeared on the upper plate in Case 2 with the random waves according to the aforementioned times, wherein, ▽ represent the pressure gauges on the upper part of the upper plate; △ the pressure gauges on the lower part of the upper plate; and ● the wave pressures (the aggregate of the wave pressures that acted on the upper and lower parts) that acted on the upper plate. The comparison of Figs. 10(a) and (b) with (c) and (d) showed that the compression wave pressures acted in (a) and (b), and the wave drag pressures in (c) and (d). That is to say, the compression wave pressures and the wave drag pressures acted before and after the time when the water level caused by the reverse waves reached the maximum at the measuring point p04. Figs. 10(a) and (b) shows that the compression pressures acted as uplift or downward forces depending on the relative degree of the compressions that affected the upper and lower surfaces, and that the uplift forces that acted at p04 and 05 which corresponded to the lee side of the horizontal plate were relatively greater. However, at the times after the water level caused by the reverse waves reached the maximum at p04, the wave drag pressures acted on the upper plate as downward forces mostly as shown in Figs. 10(c) and (d). Thus, it was confirmed that the compression wave pressures acted on the plate before the time when the water level caused by the reverse waves reached the maximum, and the wave drag pressures dominated after such time. Such trend was confirmed as having been observed in all Cases. On the other hand, the greater the wave steepness was, the larger the difference in the magnitudes of the uplift and downward forces was in the regular waves and the random waves.
The submerged dual porous horizontal plate has been investigated as a wave dissipator for diminishing the beach erosion. The coastal structure of STB was utilized by the horizontal plates. For the design of the STB, to get force information acting on plates is an essential process for the plate dimensions. This study conducted model experiment of the pressure measuring and analyzed the data. The following conclusions were obtained.
1. The seaward reverse waves created reverse phase phenomena due to the wave pressures that acted on the upper part of the dual porous horizontal plate. 2. The water levels peaked due to the collisions between the seaward reverse waves and the incident waves, and such maximum water levels produced the maximum momentary loads. 3. The seaward reverse waves produced the maximum momentary wave forces that acted on the dual porous horizontal plate toward the gravity and anti-gravity directions. 4. The seaward reverse waves produced the wave pressures that acted simultaneously on the upper and lower surfaces of the horizontal plate, and such pressures acted mostly as the tensile forces. 5. The loads caused by the seaward reverse waves acted mainly on the upper plate of the dual porous horizontal plate, and the loads toward the gravity direction appeared much stronger between the bidirectional wave pressures. 6. The distributions of the wave forces that acted on the upper plate showed trends similar to those of the water surface levels produced by the seaward reverse waves, but the wave pressures that acted on the lower plate toward the gravity direction appeared different from those toward the anti-gravity direction. 7. The compression wave pressures and wave tensile pressures occurred repeatedly before and after the time, respectively, when the water level affected by the seaward reverse waves rises to the maximum.