India is improving its economic sector. Its economy is considered after the United State and China on the purchasing power, but India dynamically builds its manufacturing plan. “After India liberalized in 1991, the services sector was long the fastest growing part of the economy, contributing significantly to GDP, economic growth, international trade and investment” (Bhunia, 2010). “During 1950-1951, the India manufacturing region has contributed entirely about 8.98% to GDP, but by 1965-1966, it has raised to 14.23%. India is relying upon on their agriculture zone that has been contributing approximately 50% of its GDP at that time. National Account stated that the manufacturing sector was arisen in growth from 2.7% in 1998-99 to 6.1% in 2002-03. The manufacturing sector grew by 8.9% in 2004-05, comfortably out-performing the sector's long term average growth rate of 7%. In the year 2014, Make It India has been launched to amend their manufacturing industry in their future” (Hoyt, 2018).
This research investigates the determinants of liquidity of Indian listed firms over the time period from 2010 to 2016. Furthermore, the objective of this study achieve by two sub-objectives as to investigate the relationship between internal determinants with the liquidity of India listed firms; and to investigate the association between external determinants with the liquidity of Indian listed firms. Liquidity is a dependent factor, while independent variables are internal determinants namely, (bank size, capital adequacy, profitability, leverage, and firm age); and external determinants namely, (Economic activity (GDP), exchange rate, inflation rate, and interest rate).
The investigation is organized as follows. Section two presents the relevant literature review of the current research. Section three discusses the methodology and data collections of the study. Hypotheses testing is formulated in section four. Findings and their interpretation are shown in sections five. The last section concludes the study.
Different scientists have studied the magnitude of liquidity management and the review of prior literature demonstrates that there is an important link between the profitability of companies and management of liquidity using distinct variables chosen for evaluation (Bagchi & Chakrabarti, 2014). Bagchi and Chakrabarti (2014) revealed a powerful adverse correlation between liquidity leadership and performance of companies, but company size has a beneficial connection to profitability of companies. Kaya (2015) indicated that company-specific determinants influencing the Turkish financial performance firms are the firm size, company age, ratio of losses, current ratio and rate of premium development. Hamidah and Muhammad (2018) revealed that firms’ profitability has the strongest influence on firms’ performance and liquidity and leverage have a significant effect on companies performance. The results also indicate that liquidity ratio, leverage ratio, and profitability have a strong association with firms’ performance. Ismail (2016) showed that current liquidity and money conversion indices have a significant and positive influence on firms’ financial performance (ROA).
Further, findings suggest that “high current ratio and longer cash conversion cycle lead firms towards better performance." Du, Wu and Liang (2016) suggested that “firm’s sufficient liquidity can increase its market value”. Bibi and Amjad (2017) proposed that money gap has a substantial and negative connection with asset return, while the current ratio has a favorable and substantial connection with the profitability of companies. Findings also indicated that the sales log and the complete asset log have a favorable and substantial connection with the profitability of companies. Sandhar, Janglani and Acropolis (2013) showed that liquidity ratios have a diminishing profitability relationship. It also stated that CR and LR had a negative relationship with (ROA and ROI), whereas Cash Turnover Ratio (CTR) had a negative association with ROI and ROA.
Azhar (2015) showed that “debtor’s turnover ratio, collection efficiency and interest coverage ratio reveal a significant influence while quick ratio, absolute liquid ratio and creditor's turnover ratio show an insignificant impact on the profitability of selected sample utilities”. Chukwunweike (2014) indicated that current ratio has a positive and substantial on profitability of firms. “There is no important particular connection between the acid test ratio and the profitability of companies”. Akenga (2017) revealed that current ratio and money reserves have a major impact on asset returns (ROA) with a level of significant 5% (p-value < 0.05). The debt ratio has shown to have no significant impact on ROA. Lyroudi, Carty, Lazaridis and Chatzigagios (1999) found that there is a positive but considerable relationship between CCC and current ratio and LR. Lyroudi K, and Lazaridis (2000) showed that there is a strong positive association between CCC and ROA. The results also revealed that there is a significant and positive association between CCC and CR and LR.
However, Velmurugan and Annalakshmi (2015) revealed that liquidity position of a firm depends on “firm size, return on investment, inventory turnover ratio, growth in sales, leverage and assets turnover ratio." Eljelly (2004) found liquidity has a strong negative association with firms’ profitability. Furthermore, the size of the firm has also indicated to have a noticeable impact on firms’ profitability. Wang (2002) revealed that CCC has a significant and negative association with firms’ profitability measured two indicators namely, (ROE and ROA). Ajao and Small (2012) showed that liquidity management measured by “credit policies, cash flow management and cash conversion cycle” has a significant influence on firms’ profitability and it is concluded that “managers can increase profitability by putting in place good credit policy short cash conversion cycle and an effective cash flow management procedures”. Niresh (2012) suggested that there is no significant correlation between liquidity ratio and profitability among the listed manufacturing companies in Sri Lanka. Bagchi (2013) indicated that there is a negative association between the indicators of liquidity management with firms’ financial performance, but company size has a strong positive relationship with firms’ profitability.
[Table 1:] Some of the Previous Studies in Different Countries
Some of the Previous Studies in Different Countries
3.1. Sample Size and Data Collection
The objective of the study aims to identify the association between internal factors and external determinants with liquidity of firm listed on Bombay Stock Exchange (BSE) in India. A sample of 2154 firms was selected among 5129 listed companies in India. Liquidity of Indian listed firms is measured by (liquid assets to total assets), whereas firm size, capital adequacy ratio, profitability, leverage, and firm age are used as internal determinants. Further, external factors are regarded: GDP, rate of inflation, exchange rate and interest rate. This study was based on secondary data sourced from ProwessQI database of the listed firms for the time period of seven years from 2010 to 2016. Further, market values of the company shares were extracted from the website of the BSE.
A panel data of 2154 listed firm for seven years is used in the current study. The panel used is analyzed employing both (linear regression with pooled, fixed, and random) effect models. Building on this model, one model has been advanced to examine the factors that may affect listed firms’ liquidity in India which are as follows:
Where
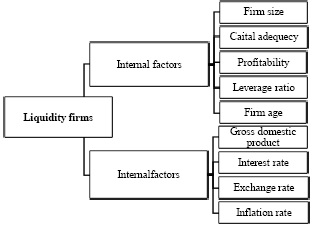
Internal factors have been categories into five proxies namely, firm size, capital adequacy ratio, profitability (ROA and ROE), leverage ratio, and firm age, while internal factors have been categories into five proxies namely, firm size, capital adequacy ratio, profitability (ROA and ROE), leverage ratio, and firm age, while Four categories of internal determinants include GDP, rate of inflation, rates of exchange, and rate of interest.
[Table 2:] Definition of Variables
Definition of Variables
To achieve the objectives of this study, the following hypotheses are stated:
H1: Firm size has a positive association with the liquidity of the listed firm in India under the period from 2010 to 2016.
H2: Capital adequacy has a positive association with the liquidity of the listed firm in India under the period from 2010 to 2016.
H3: Profitability has a positive association with the liquidity of the listed firm in India under the period from 2010 to 2016.
H4: The leverage ratio has a positive association with the liquidity of the listed firm in India under the period from 2010 to 2016.
H5: Firm age has a positive association with the liquidity of the listed firm in India under the period from 2010 to 2016.
H6: GDP growth has a negative association with the liquidity of the listed firm in India under the period from 2010 to 2016.
H7: The inflation rate has a positive association with the liquidity of the listed firm in India under the period from 2010 to 2016.
H8: The exchange rate has a negative association with the liquidity of the listed firm in India under the period from 2010 to 2016.
H9: The interest rate has a negative association with the liquidity of the listed firm in India under the period from 2010 to 2016.
Table 3 reveals the outcomes of the descriptive statistics of the current research for the period from 2010 to 2016. The descriptive statistics present the mean, maximum, minimum, and Std. Dev respectively. The liquidity ratio shows the minimum value of -1.00%, while the maximum value is 3.53%, and the mean value is 0.16%, (S.D is 0.39). For firm-specific determinants, the mean value of firm size is 1.85, capital adequacy, return on assets (ROA), return on equity (ROE), leverage ratio and firm age are -0.45%, 0.19%, 1.23%, 1.37%, and 1.34% with standard deviation of 0.50%, 0.32%, 0.48%, 10.11%, 1.56%, and 0.38% respectively. With respect to internal variables, rate of interest has a mean value of 8.07 with a standard deviation of 0.99 and (Min. = 6.40, Max. = 9.50) and the average value of exchange rate is 60.6 (Min. = 51.02, Max. = 66.25). External variables show mean values is 8.07 and 0.80 for GDP and inflation rate (S. D=0.99 and 0.16) respectively. The gross domestic product (GDP) varies between a minimum of 6.40 and a maximum of 9.50. Likewise, inflation rates between 0.56 and 1.00.
[Table 3:] Descriptive Statistics
Descriptive Statistics
5.2. Correlation and Multicollinearity Diagnostics
Table 4 shows that capital adequacy, firm size, leverage ratio, exchange rate, firm age, and Gross domestic product (GDP) have an adverse relationship with liquidity ratio, while return on assets, return on equity, inflation rate, and interest rate have a positive association with firms’ liquidity. Concerning the variance inflation factor (VIF) results, its show that all independent variables have a small correlation which shows that in this study there is no multicollinearity issue. To analyze more carefully, this study used the variance inflation factor (VIF) to test multicollinearity issues. The findings revealed that the variance inflation factor (VIF) values for all independent variables do not exceed 7.91 which suggest that there is no multicollinearity between variables (see Table 5).
[Table 4:] Correlation and Multicollinearity Diagnostics
Correlation and Multicollinearity Diagnostics
Tables 5 shows regression analysis outcomes between variables. The Adjusted R2 of the fixed effects model is 71%. This suggested that independent variables are contributing 71% of the variation in liquidity ratio. The findings reveal that leverage ratio, return on assets, and company age have a statistically significant impact on liquidity in (pooled, fixed and random) effect models, while firm age ratio, and the interest rate ratio in fixed and random effects models have a statistically significant effect on liquidity. However, the return on equity ratio has a significant but negative influence on liquidity ratio in pooled and random effects models at the level of 10%.
[Table 5:] Multiple Regression Analysis
Multiple Regression Analysis
The outcomes with respect to internal determinants also showed that company size and returned on assets ratio have a positive impact with liquidity in pooled, fixed and random effects, while capital adequacy, leverage ratio, return on equity, and firm age has an adverse effect on liquidity in models of pooled, fixed and random, except capital adequacy has a negative impact on liquidity in (pooled and random) effect models and it has a positive impact in fixed effects model. Concerning the internal factors, the outcomes indicated that GDP, inflation rate, exchange rate and rate of interest have a positive impact with liquidity ratio in pooled, fixed and random effects models. The findings similar to Bagchi and Chakrabarti (2014) and Hamidah and Muhammad (2018) revealed that liquidity management has a strong negative relationship with firms’ profitability. Consistent by Almaqtari, Al‐Homaidi, Tabash and Farhan (2018) and Al-Homaidi, Tabash, Farhan and Almaqtari (2018) who discovered that the leverage ratio had a major effect on profitability. Similar to Al‐Homaidi, Tabash, Farhan and Almaqtari (2019) who found that the liquidity ratio had a substantial influence on the measured profitability (ROE). Supported by Al-homaidi, Tabash, Farhan and Almaqtari (2019) who found that return on assets has a significant impact on liquidity. Inconsistent with Homaidi, Almaqtari, Ahmad and Tabash (2019) who revealed that firm age has a positive and insignificant impact on return on assets. Furthermore, the Hausman test was adopted to select the suitable model estimation between models of (fixed or random) effect. The P-value results indicate that the fixed-effect model is suitable as the random-effect model because the Hausman P-value test is less than 0.05 (P = 0.00 < 0.00).
Table 6 reveals the comparing results between regression of Ordinary Least Squares (OLS) model and robust regression model; the results are closely matched. Coefficient estimates are not extremely deviated from OLS regression in case of robust regression. This indicates an appropriate implementation of regression assumption. Further, the results indicate that data are not contaminated with outliers or influential observations.
Robust Regression
6. Conclusion and Implications
This paper investigates the determinants of liquidity of Indian listed firm over the time period from 2010 to 2016. The investigation uses (pooled, fixed and random effects) effect models. A sample of 2150 firms was chosen among 5129 listed firms on the Bombay Stock Exchange in India. Internal factors include bank size, capital adequacy, profitability, leverage, and firm age. While economic activity (GDP), inflation rate, exchange rate, and interest rate are the external determinants considered.
The findings reveal that leverage ratio, return on assets, and firm age have statistically significant relationship with liquidity in pooled, fixed and random effect models, while the firm size and interest ratio have a statistically significant association with liquidity in fixed and random effect models. However, the return on equity ratio has a significant negative relationship with liquidity ratio in pooled and random effects models. The results with regard to internal determinants also show that firm size and return on assets ratio have a positive association with liquidity in pooled, fixed and random effect, while capital adequacy ratio, leverage ratio, return on equity ratio, and firm age have a negative relationship with liquidity in pooled, fixed and random effects models, except capital adequacy ratio ratio has a negative association with liquidity in pooled and random effect models and has positive in fixed effect model. Concerning the external determinants, the outcomes reveal that economic activity (GDP), rate of inflation, exchange rate, and interest rate have a positive relationship with liquidity in (pooled, fixed and random effect) models.
There are three practical implications for the current research. First, it aims to fill a current gap in the liquidity literature of listed companies. Second, as a methodological contribution, it offers fresh empirical evidence using distinct statistical instruments. Finally, this research provides helpful ideas and empirical evidence on the inner and external determinants of the companies mentioned in India is very useful to bankers, analysts, regulators, investors and other stakeholders. The present study's value provides an interesting insight into the inner and external variables of the liquidity of listed companies in India. In India, however, few empirical studies have examined this problem, this research is the best of the author's understanding. First, try to explore this problem using various statistical analytical instruments and panel data from Indian listed companies that were not regarded in previous research. This research, therefore, attempts to bridge a current gap in the liquidity body of corporate literature in India.
Conflict of Interest
The authors declare that there is no conflict of interest in this paper.