As the range of technological information expands and the market demand diversifies, it is becoming more and more difficult to discover a business opportunity or create added values by relying on knowledge in a single field.
When facing competitive era on product and globalization (Liao, 2013; Seo, 2015), many countries recognize the importance of promoting high technology (Kireyeva, 2018) and the convergence between such technologies create new values (KIM, 2019; Lee & Suh, 2012). Therefore, each nation is trying its best to enhance future competitiveness by developing new converging technologies based on their forte technologies in various areas, such as IT (Information Technology), BT (Bio Technology), and NT (Nano Technology).
Technological convergence is yielding new values and affecting various fields not by a single technology but by convergence between technologies. Among the main technologies leading the technological convergence, IT is the most active of converging with other fields. BT is knowledge-intensive and strong cooperative networks are important in this area. NT is characteristic in that it and applied in various industrial fields upon the basic technology.
Thus, technological convergence for merging knowledge between heterogenous fields is now actively studied. Technological convergence has the potential of innovating future society by connecting science convergence and industrial convergence (Curran & Leker, 2011) and requires further research even more.
As the demand and necessity for technological convergence increase, many studies focusing on the regulation, corporate strategy, evaluation, and commercialization strategy of the technological convergence were carried out (Xing et al., 2011) and are expected to increase in number in the future. However, studies aiming to predict and evaluate technological convergence by using the quantitative analyzing methods are small in number. Also, they have the limitations in showing the change of trend in this field (Xing et al., 2011; Karvonen & Kassi, 2013) as most of the previous researches are done qualitatively, concentrating on case studies to establish policies based on them (Boreschi et al., 2003).
This study differs from the previous ones in two ways. Firstly, this study analyzes technological convergence in respect of input. To examine technological convergence comprehensively, it is essential to understand convergence as one of the ‘innovations’ a government or a company adopts and practices actively as an agent and a ‘system’ which changes heterogenous inputs into new outputs through various processes. However, previous researches tend to focus only on the field of outputs when analyzing technological convergence. Nonetheless, it can be taken as a convergence when different technologies and human resources are invested in respect of input regardless of the output. This study analyzes the inventors and assignees, which are main input elements of patents, in connection with the convergence of the IT-BT-NT fields. Secondly, this study examines the difference in the convergence between technologies in respect of collaboration. The trends of technological convergence according to the time flow are investigated by the fields of IT, BT, and NT while the degree of collaboration within (inventors) and between (assignees) organizations are analyzed by each technology. Many companies seek to combine internal and external resources through strategic affiliation as the performance generally increases in proportion to the degree of collaboration. This study attempts to analyze the technological fields in which these kinds of collaboration are active and aims to discover the reason based on the characteristics of each technological field.
2.1. Technological Convergence Using Patents
Information on patents are important elements in tracking the knowledge flow between technology and industry as it contains specific information on the used technology. Therefore, the awareness of the importance of the patent information as an indicator to measure the technological innovation is constantly growing (Luan et al., 2015). For this reason, many indicators using the patent information to evaluate the results of R&D activities done by various government organizations and companies have been developed, especially in developed countries such as the United States., Japan, and European Union which have invested much in science and technology. These indicators are in use as objective standards for the government and companies to examine and assess the present conditions when establishing policies, technological investments, and commercializing strategies.
Patent Analysis is being used to analyze technological innovations, especially the technological trend at a macro level (Ernst, 2003). Patent statistics, which shows the performances related to the technological innovation activities of companies, regions, and nations, is also an important measure in understanding the cooperative relationships in innovative processes or the dynamics of developing new technologies (OECD, 2008). For this reason, previous researches which assess the technological convergence have used patent data as the measurement information (Karvonen et al., 2012).
Especially when utilizing the connection information of a certain technology, most studies use the International Patent Classification to analyze the cases where a technology in a field is used in another area, a technology uses another technology from another area, or the two fields sharing a similar technology (Fai & Tunzelmann, 2001; Breschi et al., 2003; Makri et al., 2010). These researches evaluate the degree of convergence using the concepts of Herfindahl-Hirschman Index, entropy values, and concentration level (Bryce & Winter, 2009).
Patent information has three strengths in studying technological convergence.
First, the patent document is one of the richest sources of information. Therefore, they offer specific information on the trend of technological development while having the potential of providing objective and abundant information on convergence. Second, only the technologies expected to yield sufficient values are applied for patents as getting patents costs a lot of time and money. Also, unlike information in theses which announces basic research results, patents contain the technologies’ possibility of being used industrially. Thus, patents are expected to provide proactive information not only on technological convergence but also on application convergence and industrial convergence as the information on profitable inventions. Thirdly, patent information is widely available to lessen the burden of data collecting. Most of the patent databases are provided in digital forms. Also, they allow easy comparative analyses between nations as patent documents are composed in same.
2.2. The Characteristics of Technological Convergence in IT-BT-NT
New technologies such as IT, BT, and NT are speeding up technological convergence as the connection between diverse new technologies are attracting more attention over separate fields.
IT is the use of computers to store, retrieve, transmit, and manipulate data, or information, often in the context of a business or other enterprise (Wikipedia, 2018). Convergence in the field of IT has attracted much attention for a long time under the name of digital convergence. Now, the convergence phenomena where the development in the IT field is spreading through other fields are occurring rapidly.
BT is an activity of applying science and technology to the lifeforms, their parts, yields, and the models from them in the process of changing lifeforms or inanimate objects to produce knowledge, goods, and services. BT is giving birth to new industries, especially after becoming able to develop, share, and service body contents around important phenomena by collaborating with IT and NT. Also, BT is a knowledge-intensive technology with long development periods and huge R&D expenditures to make it the field which requires cooperative networks the most. For example, fusion between BT and IT includes biochips, biocomputer, and fusion between BT and NT include nano-biosensor and nano-medicine.
NT is defined as using a collection of atoms or particles in nano units or a product composed of atoms or particles in nano units in the process of manufacture. Nanotechnology is used by many companies in various fields like materials, automobiles, airplanes, electronics, health, environment, and national defense, and it is expected to change the industrial environment dramatically by spreading to many economic fields (Shea & Christine, 2005).
2.3. Collaboration in the Fields of New Technology
Most companies exposed to rapidly changing business environment and the threat of the age of limitless competition cannot perform effectively with only their capacities. Furthermore, they cannot secure a competitive advantage in the long run. Strategic alliance is used widely as a main strategic alternative to strengthen some assets a company lacks and emerged as a prominent and critical industrial practice (Hamel et al., 1989; Murry & Mahon, 1993; Powell et al., 1999; Kim & Youn, 2019). Collaboration is defined as a cooperation of two or more members by working together to create a competitive advantage (Suong, 2017) When collaborating for technological development with external entities, companies which succeeded in maintaining the collaboration were more creative in their innovations; collaboration with various resources were more effective than that with a single resource; and collaboration with suppliers, customers, and research institutes were better to produce innovation results than that with rivals (Nieto & Santamaria, 2007).
Collaboration between inventors or assignees is also important in patents, which are the representative results of technological development. New inventions tend to come out as a result of combining existing knowledge of different individuals in new ways rather than as an idea of a singular inventor. In other words, the process of the invention is a series of combination, a method of producing new knowledge by combining intermittent knowledges. Nowadays, as knowledge is adding its amount and complexity day by day, interactions between different but complementary expertise are required in inventing something new (Ejermo & Karlsson, 2006).
This technological convergence is called a cooperative convergence, as it occurs in the process of collaboration based on constant sharing of knowledge and communication between technologies. Notably, companies in science-based industries can gain significant benefits from cooperating with universities and research institutes when innovating. BT and NT industries show great results from technological development collaboration with universities and research institutes (Laursen & Salter, 2006). Therefore, more and more organizations cooperating with others as well as colleagues collaborating with other members of their organizations are applying for patents.
This study conducted an analysis using the patent data to confirm what kind of cooperative convergence characteristics the collaboration between persons and organizations show according to the years, technological fields, and patent registration among IT, BT, and NT.
3.1. Data Collection and Categorization
This research used the patent information applied for and granted by Korean applicants in the United States Patents and Trademark Office from 2002 to 2016 to analyze the convergence characteristics of IT, BT, and NT. US patents are chosen because excellent patents tend to be applied for in the US before Korea. Also, the US patents are available for references (backward/forward citation) to allow diversity in researching.
Later, the IT, BT, and NT patents are categorized under representative classes according to the IPC (The International Patent Classification) as technologies are mainly defined under the IPC classes or subclasses when evaluating technological convergence based on patent information (Figure 1). Application and registration of patents which belong to certain IPC classes are extracted according to OECD’s IT, BT, and NT categorizing standards (Table 1).
[Table 1:] OECD Patent Category
OECD Patent Category
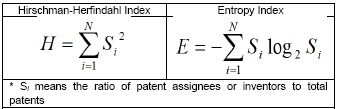
Firstly, concentration level analysis was conducted by dividing the patent information of IT, BT, and NT collected and categorized by IPC standards into inventors and assignees in respect of input. Inventors recorded in a patent specification mean human resources in the same organization while assignees mean those from different organizations. Therefore, it shows the degree of internal and inter-organizational collaboration respectively. Lower concentration level means more inventors and assignees, and higher concentration level means the opposite. To analyze this concentration level, Hirschman-Herfindahl Index and Entropy Index were used.
The Hirschman-Herfindahl index is the sum of the squares of the percentage of applications (Si) of each assignee among the total number of applications in each technical field, changing between 0 and 1. Index closer to 1 means higher concentration level while that closer to 0 means lower concentration level, which means more active convergence.
Entropy is a method of showing the degree of physical disorder. Generally, materials tend to go in the direction of increasing the entropy in nature. Entropy Index, which shows this state of disorder, can be used as an indicator showing the concentration level. Higher entropy index means the lower concentration level, which means the ongoing of convergences.
While Hirschman-Herfindahl index provides information on concentration using relatively simple indicators, it is necessary to analyze additional information on specific competition patterns. Entropy Index is a method mainly used to identify the characteristics of related technical fields, and it is possible to grasp the change of concentration. Several studies have developed indices of technological convergence such as Hirschman-Herfindahl index and Entropy Index. Gambardella and Torrisi (1998) suggested the Herfindal index to patent data from 1984 to 1992 in order to measure technological diversification. Chen and Chang (2012) applied an entropy index for investigating the influences of related technological diversification and unrelated technological diversification.
Also, Analysis of Variance (ANOVA) which judges the statistical significance in average differences between multiple groups was conducted to analyze the characteristics of technological convergence such as the differences in registration proportion between IT, BT, and NT or the differences between inventors and assignees. Although T-test is used to test the average differences between groups, ANOVA using F-test should be used when there are more than three groups as the simultaneous analysis becomes more difficult. F-test is a testing method to examine the differences between groups by using the groups’ variance. The variance of a certain group shows how heterogeneous or homogenous the samples consisting the groups are.
ANOVA assumes independence, normality, and homogeneity of variances. Independence means that an estimated figure of a sample is not affected by other estimated figures of other samples. Normality means that the distribution of the estimated figures forms a normal distribution. Homogeneity of variances means that the variances between groups are the same.
4.1. Present Conditions of Applying for and Registering Patents
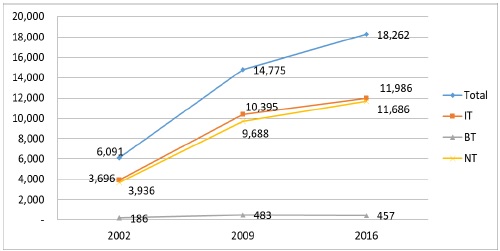
When looking into the present conditions of Korean applicants applying for patents in the U.S. from 2002 to 2016, the numbers of application are 6,091 in 2002, 14,775 in 2009, and 18,262 in 2016, which is about CAGR (Compound Annual Growth Rate) 7.6%. Especially, IT has occupied the most significant proportion of the three technological fields with the application numbers of 2,936 in 2002, 10,395 in 2009, 11,986 in 2016 and CAGR 7.7%.
BT shows the lowest degree of proportion and growth with the number of application of 186 in 2002, 483 in 2009, 457 in 2016, and CAGR 6.2%. NT shows the greatest degree of growth with the number of application of 3,696 in 2002, 9,688 in 2009, 11,686 in 2016, and CAGR 8.0%.
When looking into the granted patents among the patents applied for by Korean applicants from 2002 to 2016, the number is growing from 5,816 in 2002, 11,708 in 2009 to 3,642 in 2016 with CAGR 9.1%. The number of granted patents in 2016 is low because patents take two to three years to go through an evaluation and be granted. It will show the increasing tendency when the time of registration arrives.
Specifically, IT has the highest rate of registration increase among the three fields with the number of 3,722 in 2002, 8,403 in 2009, 2,798 in 2016, and CAGR 10.7%. BT has the lowest increase rate with the number of 174 in 2002, 275 in 2009, 63 in 2016 and CAGR 5.9%. NT shows the number of 4,057 in 2002, 7,689 in 2009, 2,443 in 2016 and CAGR 8.3%
4.2. Present Conditions of Convergence in respect of the Concentration Level
The concentration level of the IT, BT, and NT, that is to say, the degree of convergence, was analyzed in respect of inventors and assignees by using the Herfindahl-Hirschman Index and Entropy Index introduced under the analytical models. Firstly, when based on inventors and looking into the Herfindahl-Hirschman Index, BT is the closest field to 0 while showing the highest Entropy Index to show that it is the field where the convergence from internal collaboration occur most frequently. Also, BT shows the highest convergence level based on assignees to show that it is the field where collaboration between organizations is vigorous.
[Table 2:] Present Conditions of Convergence Based on Patent Application
Present Conditions of Convergence Based on Patent Application
4.3. Analysis on the Differences between Technologies Using the ANOVA (Inventor’s Perspective)
ANOVA was conducted by calculating the Hirschman-Herfindahl Index based on the number of inventors, which shows the degree of internal collaboration in respect of inputs. ANOVA is an F-test to determine whether variables have a significant impact on observations. Additionally, the larger the value of the F statistic, the higher the fit of the model. Bottom line of the table is a summary of the underlying regression. The root mean squared error (Root MSE) is 0.0245, R-squared for the model is 0.7627 and adjusted R-squared is 0.6638. The closer R-squared is to 1, the higher the explanatory power of this model. This model is close to 1.
As a result, we found that the model including the variables of technology, year and registration appeared to be significant at better than the 1% level (higher value of F statistic, 7.71). We can see that the significance level is 0.0011 (F statistic = 12.61, p value = 0.0011), which is below 0.01 in technology (IT, BT and NT). We can also see that the significance level is 0.0114 (F statistic = 6.65, p value = 0.0114), which is below 0.05 in year (2002, 2009 and 2016).
ANOVA was also conducted by calculating the Entropy Index based on the number of inventors in respect of inputs. As a result, the analytical model was also valid. When looking into F statistic and P value, technology and year shows the difference and suggest significance in similar results of Hirschman-Herfindahl Index (Table 3)
[Table 3:] Summary of Hirschman-Herfindahl Index & Entropy Index (Inventor)
Summary of Hirschman-Herfindahl Index & Entropy Index (Inventor)
[Table 4:] Details of Hirschman-Herfindahl Index & Entropy Index (Inventor)
Details of Hirschman-Herfindahl Index & Entropy Index (Inventor)
However, we do not know which of the specific groups differed in Table 3. So, we examined Hirschman-Herfindahl Index and Entropy Index in detail on the basis of the number of inventors in Table 4. And to look into this finding in more details, BT and NT were compared based on IT in respect of Hirschman-Herfindahl Index for technology. Only BT showed significance with the highest value, which means the highest level of convergence. Similarly, the year was also analyzed based on the year 2002 to show significance in both 2009 and 2016, which suggests that the convergence level increases as time passes.
4.4. Analysis on the Differences between Technologies Using the ANOVA (Assignee’s Perspective)
ANOVA was conducted by calculating the Hirschman-Herfindahl Index based on the number of assignees, which shows the degree of internal collaboration in respect of inputs. Bottom line of the table is a summary of the underlying regression. The root mean squared error (Root MSE) is 0.0271, R-squared for the model is 0.9133 and adjusted R-squared is 0.8778. This model is quite closer to 1 compared with the number of inventors.
As a result, we found that the model including the variables of technology, year and registration appeared to be significant at better than the 1% level (higher value of F statistic, 25.43). We can see that the significance level is below-0.0000 (F statistic =56.60, p value = 0.0000), which is below 0.01 in technology (IT, BT and NT). We can also see that the significance level is 0.0139 (F statistic = 6.24, p value = 0.0139), which is below 0.05 in year (2002, 2009 and 2016).
ANOVA was also conducted by calculating the Entropy Index based on the number of inventors in respect of inputs. As a result, the analytical model was also valid. When looking into F statistic and P value, technology, year and registration shows the difference and suggest significance in similar results of Hirschman-Herfindahl Index (Table 5).
[Table 5:] Summary of Hirschman-Herfindahl Index & Entropy Index (Assignee)
Summary of Hirschman-Herfindahl Index & Entropy Index (Assignee)
[Table 6:] Details of Hirschman-Herfindahl Index & Entropy Index (Assignee)
Details of Hirschman-Herfindahl Index & Entropy Index (Assignee)
We also examined Hirschman-Herfindahl Index and Entropy Index in detail on the basis of the number of assignees in Table 5. To look into the analyses in more detail, BT and NT were compared based on IT to show the significance in BT, which showed the lowest value and suggested the high degree of convergence. Similarly, the year was also analyzed based on the year 2002. The year 2009 and 2016 both showed significance, which suggests that the level of convergence increases as time passes.
To look into the findings in more detail, BT and NT were compared based on IT. Only BT was shown to be significant with the highest value, which means the high degree of convergence. Similarly, the year was also analyzed based on 2002. Only the figures of 2016 were shown to be significant, which shows that convergence increased a lot recently. Also, when analyzing the applied and granted patents based on application, the granted patents showed significance. It can be confirmed that the degree of registration convergence is relatively higher (Table 6).
This study aimed to analyze the convergence in the fields of IT, BT, and NT and the differences between technologies quantitatively in respect of collaboration within(inventors) and between(assignees) organizations, using the data of Korean applicants applied for patents in the US from 2002 to 2016. For this purpose, Hirschman-Herfindahl Index and Entropy Index were used when analyzing the present conditions of convergence by three technological fields using the number of inventors and assignees. Also, ANOVA was used to check if there are any differences between three technological fields by technologies, years, and registration. The results are as follows.
First, the degree of convergence in IT-BT-NT are constantly growing since 2002. As time flows, Hirschman-Herfindahl Index gets closer to 0 while the Entropy Index increases. Both show that the convergence is constantly increasing. Second, BT is shown to be the most active for collaboration within and between organizations field among IT, BT, and NT. This tendency shows similarly in the field of granted patents to show the BT’s characteristics which need a vast range of knowledge and various collaboration networks. Third, there are differences in the degree of convergence depending on the technological fields and years among IT, BT, and NT. However, the Entropy Index of the granted patents based on assignees shows higher levels, which means that the granted patents have higher degrees than the pending patents.
As examined in the literature review, this result of analysis confirms that the technological convergence is on the rise constantly regardless of the technological fields and years, and that BT is characteristic in that internal and external collaboration are significant. However, collaboration between various organizations are found to be necessary as the collaboration between organizations show active convergence when looking into the registered patents.
Although active engagement and internal cooperation of employees in business is a very important factor (Kazemi et., 2017), organizations cooperate with other institutions to sustain their competitiveness with limited internal resources; thus, they produce market values by using their partners’ complementary resources. In turn, this becomes their pedestal to maintain constant competitive advantages. Therefore, collaboration is a way for an organization to gain insufficient resources from the outside and the main measure to achieve innovation results which will not attainable by relying only on internal capacities (Powell et al., 1999; Hwang & Suh, 2017). Successful companies typically develop strong corporate cultures that encourage and reinforce those attitudes to which the company owes its market success (Jetter et al., 2009).
These kinds of collaboration will speed up convergence in various technological fields. Companies in these fields are recommended to perform diverse strategies to pursue further collaboration with the outside.
This study has its limitations as it could not grasp exact numbers of the granted patents in 2016 as it collected data based on application. Therefore, analysis on exact granted patent database after one or two years when the applied patents are granted. Also, some technologies were overlapped between IPC categories despite the IT, BT, and NT categorization. Especially, NT had many cases of being contained in IT or BT. Establishing clearer categories is required in the future. Lastly, studies analyzing a certain technological field further will be needed other than simultaneously analyzing main technological fields of IT, BT, and NT.