Chlorinated hydrocarbons, such as trichloroethylene (TCE) and perchloroethylene (PCE), are volatile organic compounds (VOCs) which are highly persistent in the natural environment [1]. Atmospheric chlorinated hydrocarbons result mainly from a broad range of industrial applications, as solvent, paint strippers, and degreasing and/or cleaning agents, due to their low flammability, as well as their high evaporation rate and low reactivity [2]. In addition, these compounds have a range of indoor sources such as building materials and household products [3,4]. As such, both TCE and PCE, along with other VOCs, have been prevalently detected in indoor?as well as outdoor?environments [4-6]. Moreover, these compounds belong to a group of hazardous aliphatic hydrocarbons which are suspected of being carcinogenic and mutagenic [7]. These characteristics of TCE and PCE prompted the development of multiple technologies for the minimization of health hazards from their industrial exposures.
Over a traditional technique of activated carbon application, photocatalytic processes via semiconductors have become an attractive technology for the removal of such products from air, because it has the potential to oxidize several VOCs and has a relatively high degradation efficiency under certain operating conditions [8-10]. Among several semiconductors, titanium dioxide (TiO2) is the most commonly employed photocatalyst, due to its low cost, ready availability, and chemical stability [11]. However, TiO2 exhibits a relatively high activity only under UV light, which exceeds the band-gap energy of 3.0 or 3.2 eV in the rutile or anatase crystalline phase, respectively, limiting its practical applications under visible-light regions [12]. As such, modifications of photocatalysts to enhance light absorption and photocatalytic activity under visible-light irradiation have been the focus of recent studies.
The techniques proposed to modify the electronic properties of bulk TiO2 photocatalysts include dye sensitization, transition metal doping and non-metal doping [13-16]. A doping route with a non-metal element, nitrogen (N), is one of the most recent techniques to exhibit relatively high activity under visible light [13,15,16]. Specifically, N-doped TiO2 prepared by Zhang et al. [15], exhibited elevated light absorption and photocatalytic activity at λ > 430 nm for the degradation of acetone. However, many previous studies applied conventional lamps as the primary visible-light source, such as fluorescent daylight lamps and Hg-Xe lamps. More recently, light-emitting diodes (LEDs) have
received attention for photocatalytic applications, as they are more efficient in converting electricity into light due to their high quantum yields close to unity, thereby leading to low electricity consumption [17]. Accordingly, the current study investigated the applicability of visible-light LEDs for the photocatalytic degradation of indoor-levels of TCE and PCE over N-doped TiO2 (N-TiO2). These target compounds were selected on the basis of their prevalence and toxic potentials [1,7], which make them suitable reference compounds for a host of other associated VOCs.
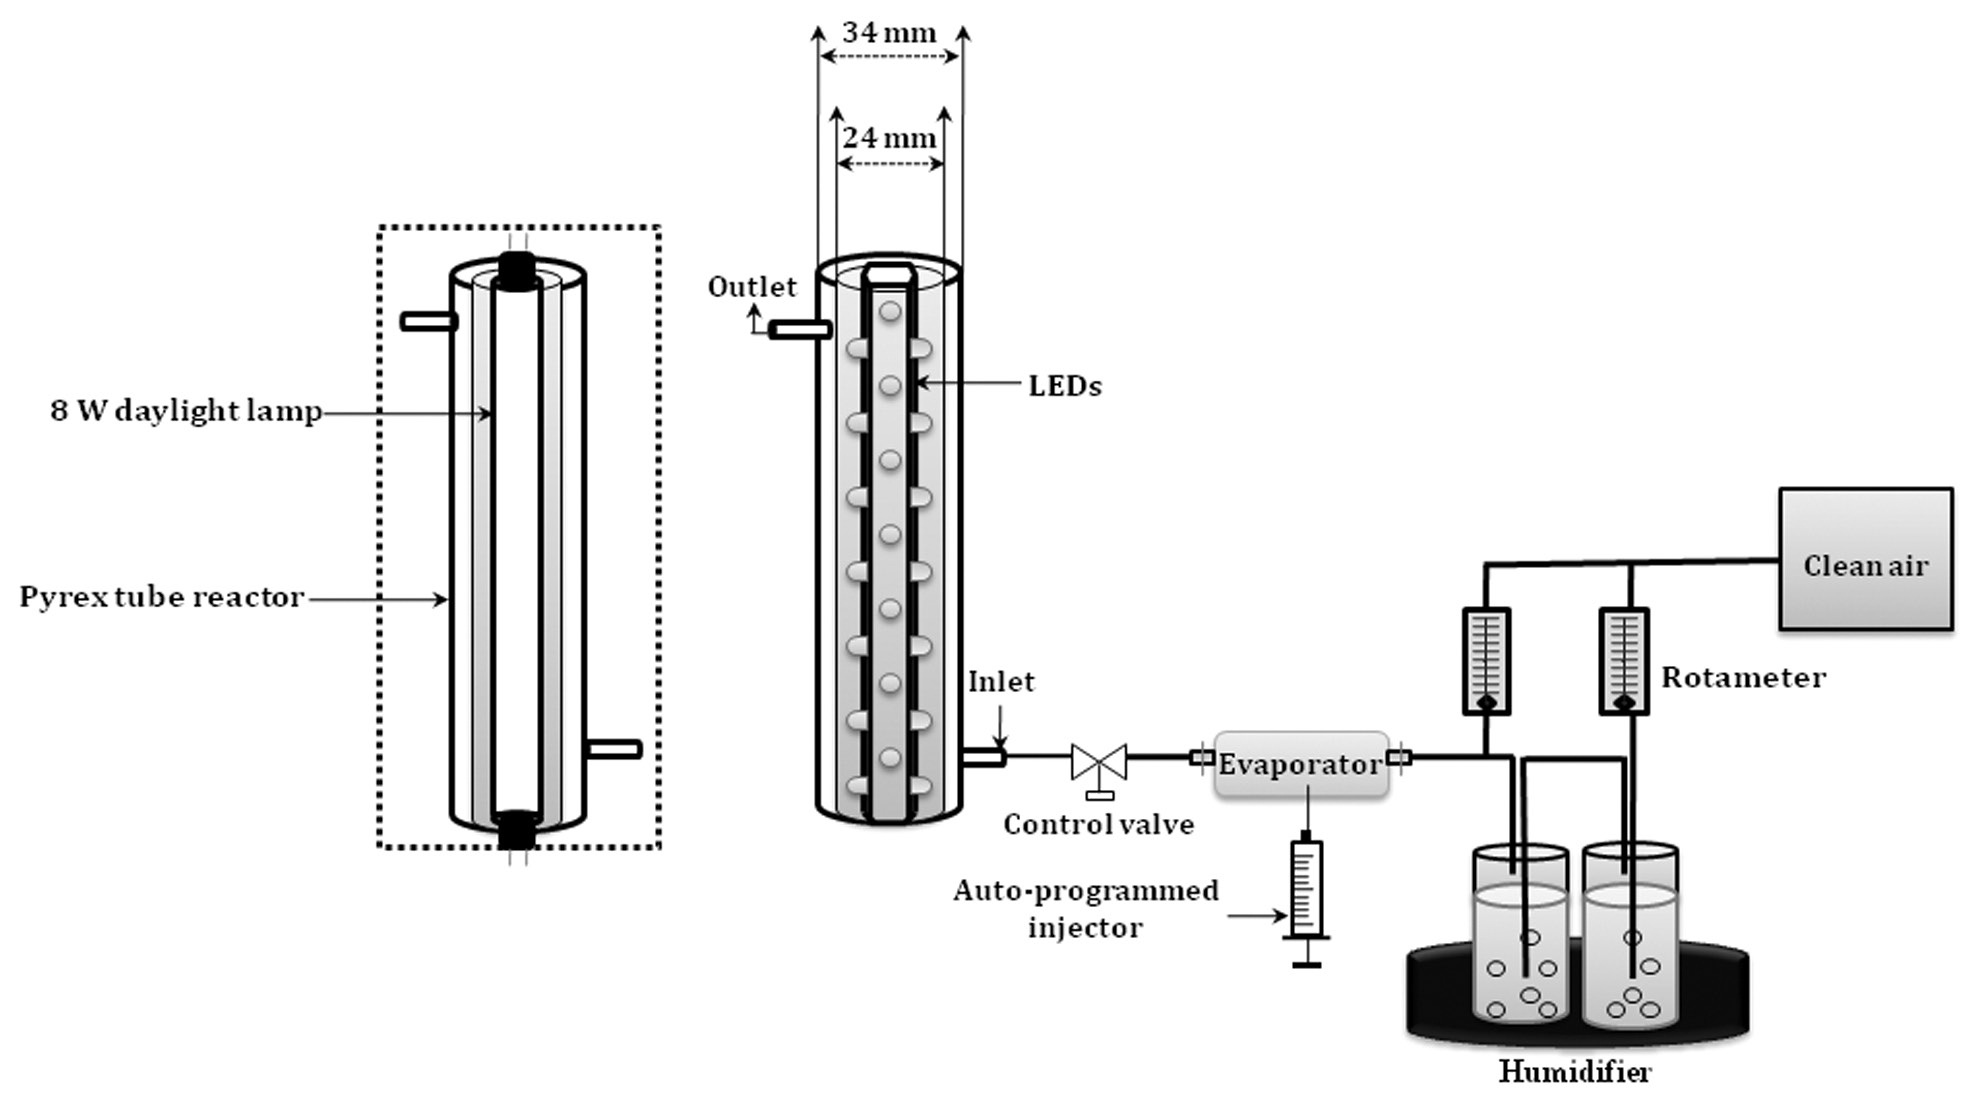
The experimental set-up, including a Pyrex photocatalytic reactor, is shown in Fig. 1. The photocatalytic reactor was constructed using two Pyrex tubes with different diameters, but with a same length. A conventional lamp or a hexahedral tube containing LED lamps was inserted inside the smaller-diameter Pyrex tube. The hexahedral tube was made of Teflon to support the LED installation. The inner wall of the outer Pyrex tube was coated with a thin film of the N-TiO2 photocatalystocatalytic reactor was constructed to direct the flow of incoming air toward the light source, so as to elevate the air turbulence inside the reactor, which enhances the distribution of the target compounds onto the N-TiO2 surface. The standard gas was prepared by injecting standard TCE and/or PCE into a mixing chamber via a syringe pump (KDS210; KD Scientific, Holliston, MA, USA) and was allowed to flow through the annular region between the two Pyrex tubes. The humidity level was controlled by passing zerograde air through a charcoal filter, and then through a humidification device in a water bath. The stream flow rate was controlled using flow meters which were calibrated against a mass flow meter.
N-TiO2 photocatalysts were prepared utilizing urea as an N source for mechanical N-doping. A 8 g of commercially available TiO2 powder (P-25; Degussa, Essen, Germany) was added to 20 mL of aqueous solution of the organic nitrogen compounds, and was stirred at room temperature for 1 hr. This solution was kept in the dark for 1 day and was then dried under reduced pressure. N-TiO2 powder was calcined at a specified temperature for 1 hr under aerated conditions to result in the formation of a yellow powder. The calcined powder was washed with diluted sulfuric acid and then with pure water, and vacuum-dried. The pH of the final solution was 7. The prepared N-TiO2 powders were characterized using a diffuse reflectance ultraviolet-visible-near infrared (UV-VIS-NIR) spectrophotometer (CARY 5G; Varian, Palo Alto, CA, USA) and an X-ray diffractometer (XRD; D/MAX-2500; Rigaku, Tokyo, Japan).
2.2. Operational Conditions and Measurements
The photocatalytic activities of N-TiO2/LED system were evaluated under different operational conditions. The photocatalytic tests were performed under conditions of visible-light. Operational parameters examined were the calcinations temperature of N-TiO2 powders, light-source types, input concentrations, stream flow rates, and relative humidity. Four different calcination temperatures were tested: 350℃, 450℃, 550℃, and 650℃. Visible-light sources involved one conventional lamp (8-W fluorescent daylight lamp, F8T5DL; Younghwa Inc., Seoul, Korea) and two visible LEDs?2.1-W blue (IWS-L5056-VB-K3; Itswell Co., Incheon, Korea) and a violet lamp (IWL-V5R30-F-TNB; Moksan Electronics, Seongnam, Korea). The light intensities were measured at a distance from the light source equal to half the hydraulic diameter of the reactor, by using a digital Lux meter (DX-100; INS Enterprise, Taipei, Taiwan). The input concentration range surveyed was 0.05?1.0 ppm (0.05, 0.1, 0.5, and 1.0 ppm). The input concentrations of TCE and PCE were controlled by adjusting the stream flow rate of supplied air, and the injection rate of standard gas, which was prepared by injecting liquid standards
into an evaporating apparatus via an auto-programmed syringe pump (KDS210; KD Scientific).
The stream flow rate range investigated was 0.5 to 1.5 L/min (0.1, 0.3, 0.5, and 0.7 L/min). The relative humidity ranged from 20% to 90% (20%, 45%, 70%, and 95%) to cover both dried and humidified environments. Other parameters were fixed to their representative values: calcinations temperature, 450℃; light source, blue LEDs; input concentration, 0.1 ppm; relative humidity, 50?55%; stream flow rate, 0.5 L/min; and relative humidity, 45%. The amount of TiO2 film coated inside the reactor was 0.43 mg/cm2.
A time-series of gaseous measurements were collected at the inlet and outlet of the photocatalytic system prior to and after turning on the lamp. Prior to turning on the lamp, six 10-min samples were collected at 30 min intervals over 3 hr. Three hr after the introduction of the target compounds (after adsorption equilibrium as indicated by equality between the inlet and outlet concentrations), the lamp was turned on, and another series of six 10-min samples were collected at 30 min intervals for a further 3 hr. The catalyst was pretreated for several hours by making zero-grade air flow through the illuminated reactor. The catalyst pretreatment was performed after the humidity level at the reactor outlet reached equilibrium. When no contamination with the target compounds was measured in the reactor, the target compounds were introduced.
Gas samples were collected by filling an evacuated Tedlar bag at a constant flow rate. Air from this bag was then drawn through a sorbent trap containing 0.3 g of Tenax TA using a constant flow-sampling pump (224-PCXR8; SKC Inc., Eighty Four, PA, USA). All samples were taken at ambient room temperature (19?25℃). The target compounds collected on the sorbent trap were analyzed by coupling a thermal desorption system (PerkinElmer ATD 400; PerkinElmer Waltham, MA, USA) to a gas chromatograph (Agilent 7890A; Agilent, Santa Clara, CA, USA) with a flame ionization detector, using a 0.32-mm-i.d. by 60-m-length fused silica column (Supelco SPB-5; Sigma Aldrich, St. Louis, MO, USA). The quality assurance/quality control program for the measurement of target compounds included laboratory blank traps and spiked samples.
3.1. Photocatalytic Degradation Efficiencies According to Calcinations Temperature
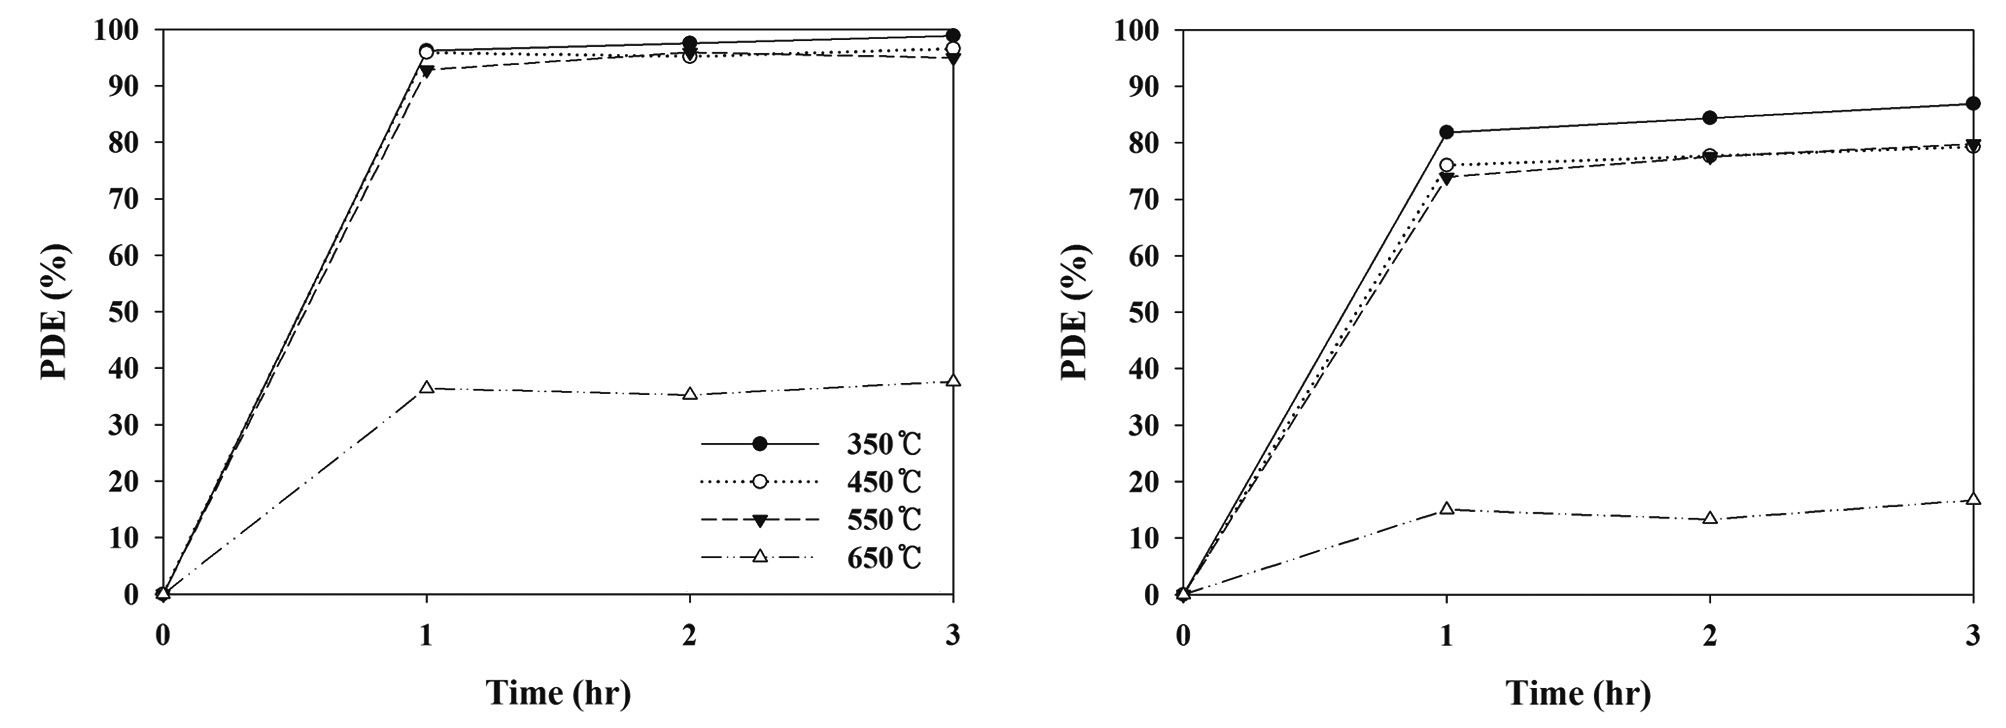
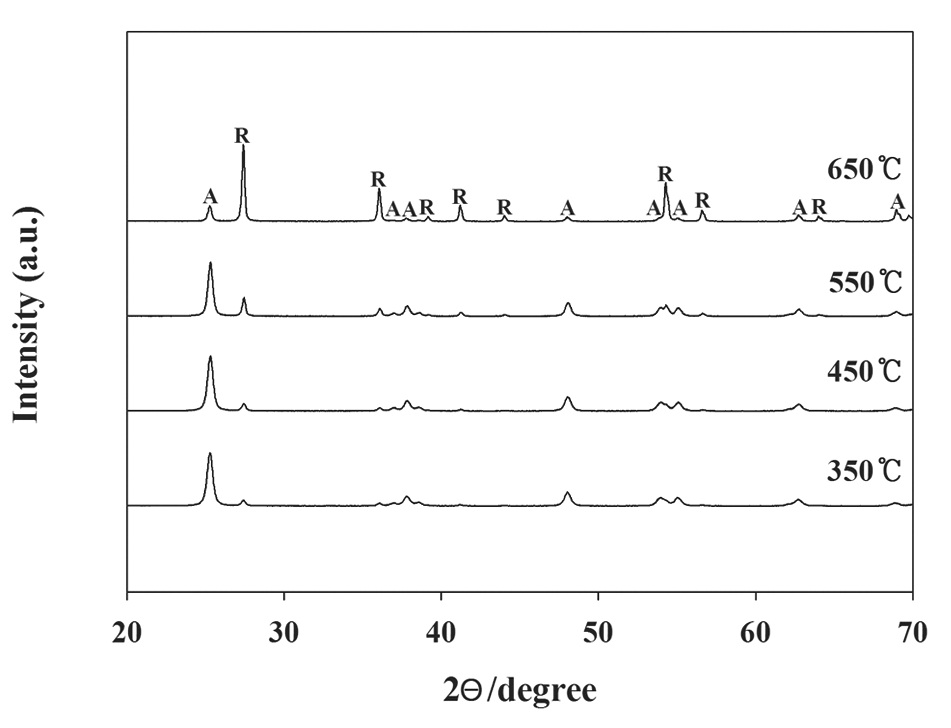
It was hypothesized that different calcination temperatures might yield different photocatalytic behaviors due to different morphological and optical properties of N-TiO2 photocatalysts. Consequently, this study investigated the photocatalytic degradation efficiencies for TCE and PCE, as determined using a LED-activated N-TiO2 photocatalytic system, based on a variety of calcination temperatures. As shown in Fig. 2, the N-TiO2 photocatalyst calcined at 650℃ (defined as N-650) showed the lowest degradation efficiencies for TCE and PCE, while the N-TiO2 photocatalysts calcined at 350℃, 450℃, and 550℃ (defined as N-350, N-450, and N-550, respectively) exhibited similar or slightly different degradation efficiencies for TCE and PCE. The average degradation efficiencies for TCE and PCE over a 3 hr photocatalytic process regarding the N-650 were 33% and 12%, respectively. The average degradation efficiencies for TCE and PCE regarding the other photocatalysts were above 90% and 70%, respectively. Higher photocatalytic activities obtained from the N-350, N-450, and N-550 were attributed to the combined effects of the morphological and optical properties of the photocatalysts. This assertion is supported by the XRD patterns of the N-TiO2 photocatalysts calcined at four different temperatures (350℃, 450℃, 550℃, and 650℃). Fig. 3 demonstrated that N-650 had a more rutile and less anatase crystal phase, when compared to the other N-TiO2 photocatalysts (N-350, N-450, and N-550). As such, as presented in Table 1, the ratio of anatase at 2θ = 25.2°
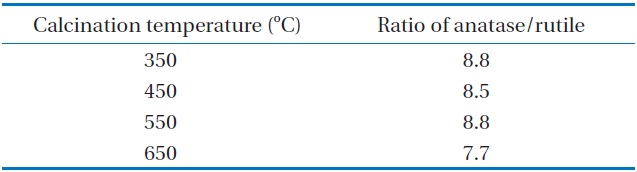
The ratios of anatase at 2θ = 25.2° to rutile at 2θ = 27.4° according to calcination temperature
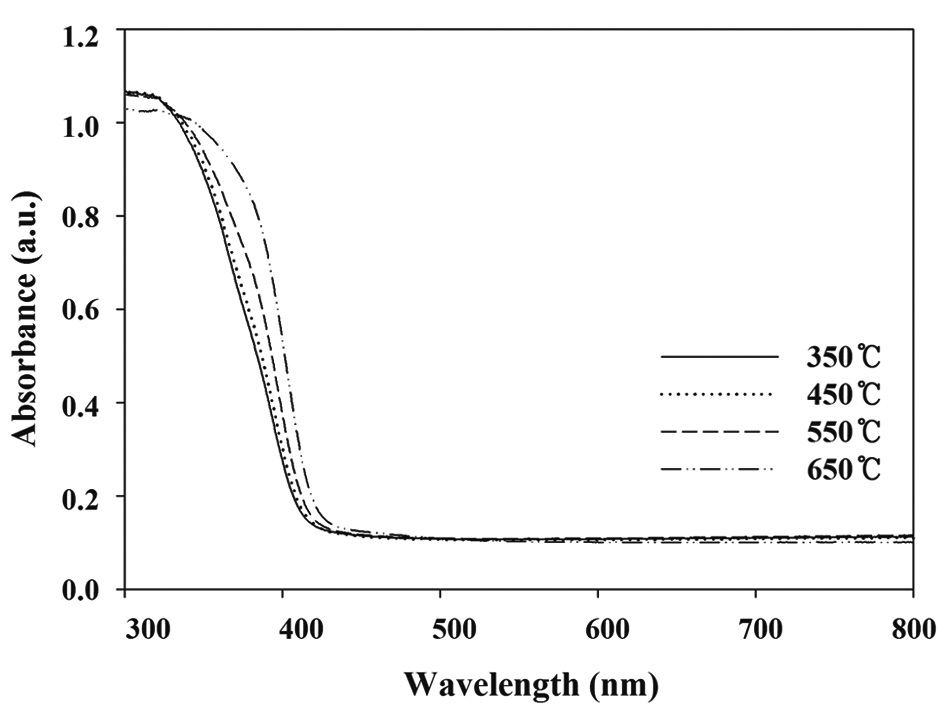
to rutile at 2θ = 27.4° was lowest for the N-650. This pattern is consistent with those found in previous studies [18,19], which reported that the anatase content of the composites decreased with increasing calcination temperature, and that the rutile contents increased. A possible explanation for these results is that the mobility of electrons for anatase is higher than that of rutile, due to the lower effective mass of electrons, the higher production rate of electron-hole pairs, and the lower recombination rate for anatase [20]. However, Fig. 4 reveals that the UV-visible spectra for N-650 was shifted more to the visible range, which favors more absorption of visible light, and elevates photocatalytic activity. Consequently, a possible assumption regarding the low degradation efficiency determined for N-650 is that the effect of low anatase contents on degradation efficiency of TCE and PCE might surpass the high visible-light absorption effect.
3.2. Photocatalytic Degradation Efficiencies According to Lamp Type
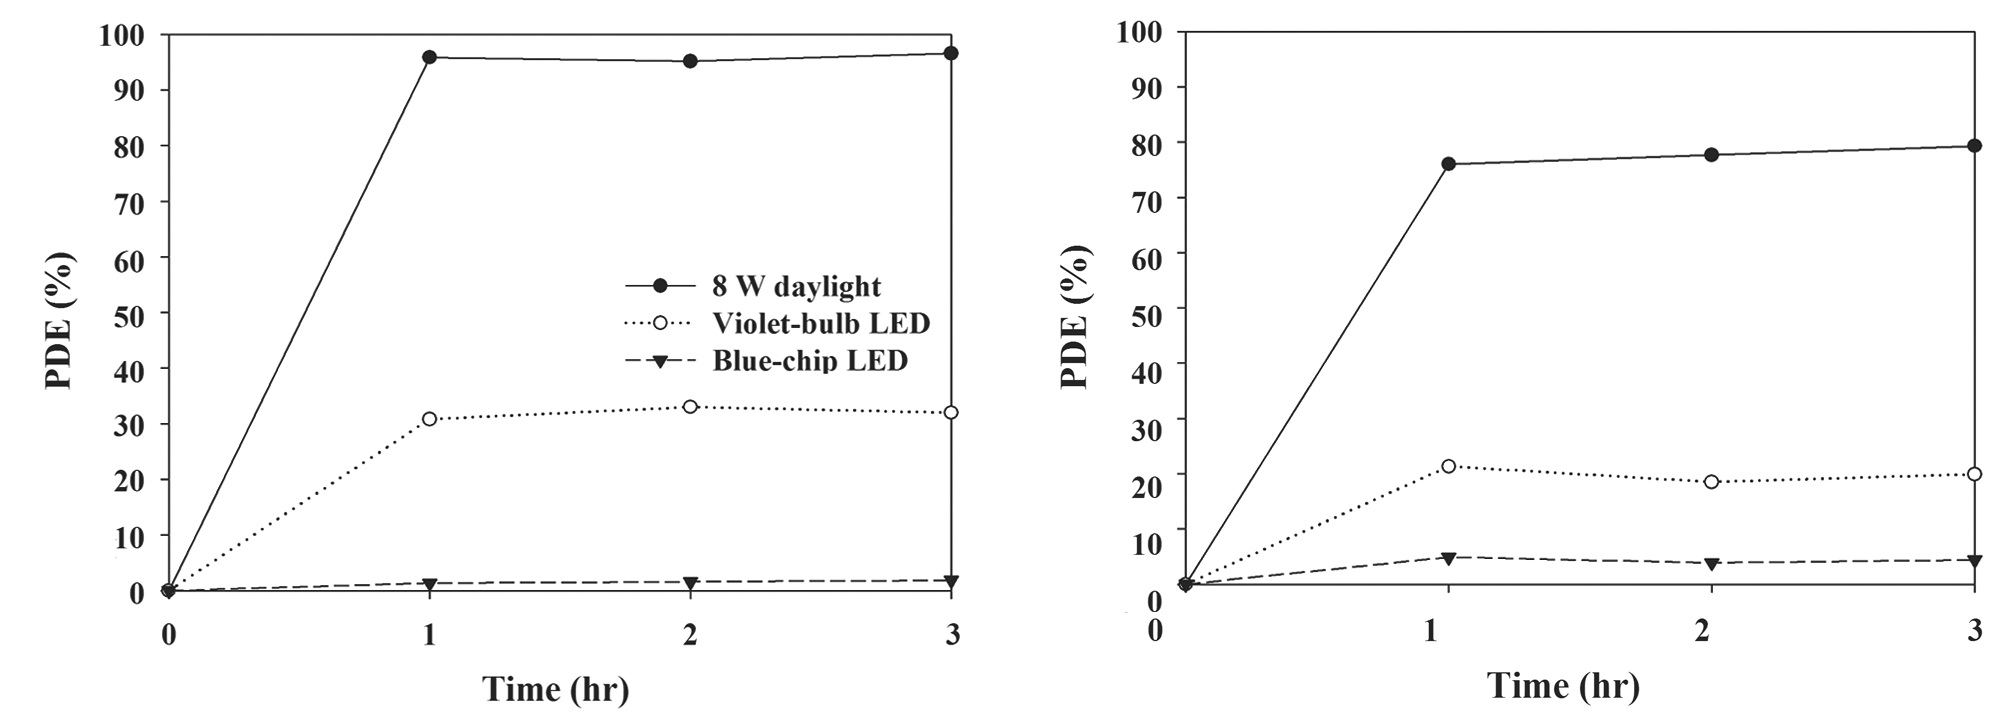
Fig. 5 represents the photocatalytic degradation efficiencies for TCE and PCE, as determined via a photocatalytic system with N-TiO2 according to lamp type. The degradation efficiencies for both target compounds were in the descending order of 8-W fluorescent daylight lamp, violet and blue LEDs. The respective average degradation efficiencies for TCE and PCE were 96% and 77% for the 8-W lamp/N-TiO2 system, 32% and 20% for the violet LED/N-TiO2 system, and ~0% and 4% for the blue LED/N-TiO2 system. Photocatalytic degradation efficiency is proportional to light intensity [21,22]. Consistently, the 8-W fluorescent lamp, which exhibited the highest degradation efficiency, had the highest light intensity of 1.8 mW/cm2, compared to that of violet (0.7 mW/cm2) and blue (1.6 mW/cm2) LEDs. These findings suggest that under the experimental conditions used in the present study, light intensity was an influential parameter for the difference in degradation efficiency between the fluorescent lamp and LEDs. Meanwhile, the wavelength of the fluorescent lamp was distributed at a wide range of 400?720 nm, which comprised of higher wavelengths than violet (400 nm) and blue (450?475 nm) LEDs. Therefore, the higher degradation efficiency for the fluorescent lamp/N-TiO2 system was most likely due to higher light intensity, rather than the difference in wavelength. However, the violet LED/N-TiO2 system exhibited higher degradation efficiencies for TCE and PCE than those of blue LED/N-TiO2 system, although the result was reversed for light intensity. In contrast to the fluorescent lamp/N-TiO2 system, the higher degradation efficiency for the violet LED/N-TiO2 system than for the blue LED/N-TiO2 system was attributed higher light absorbance by N-TiO2 powders at lower wavelength. In this case, the effect of the lower wavelength is likely to outweigh the effect of light intensity on photocatalytic degradation of the target compounds. Consequently, the difference in degradation efficiency between the light sources was attributed to the combined effects of wavelength and light intensity. Meanwhile, the light intensities of LEDs used in this study were different from those used in the study of Chen et al. [23]. This difference is attributed to the characteristics of LEDs prepared by different manufacturing companies.
In addition, the photocatalytic degradation efficiencies for TCE and PCE were normalized in terms of energy consumption (%/W), so as to compare the energy efficiencies of two photocatalytic systems (violet LED-irradiated N-TiO2 and 8-W fluorescent daylight lamp-irradiated N-TiO2 systems), which were calculated by dividing the degradation efficiencies by the electric power supplied. In contrast to the photocatalytic degradation efficiencies, the normalized photocatalytic degradation efficiencies for TCE and PCE of the violet LED-irradiated N-TiO2 system were higher than those of the 8-W fluorescent daylight lampirradiated N-TiO2 system. The normalized photocatalytic degradation efficiencies for TCE and PCE of the violet LED-irradiated N-TiO2 system were 16 and 10%/W, respectively, while those of the 8-W daylight lamp-irradiated N-TiO2 system were 12 and 9.6%/W, respectively. These findings confirm that violet LEDs can be utilized as energy-efficient light sources for the photocatalytic degradation efficiency for TCE and PCE. Accordingly, when prioritizing the energy efficiency of light sources, violet LEDs are recommended for use in N-TiO2 photocatalytic systems.
3.3. Photocatalytic Degradation Efficiencies According to Input Concentration
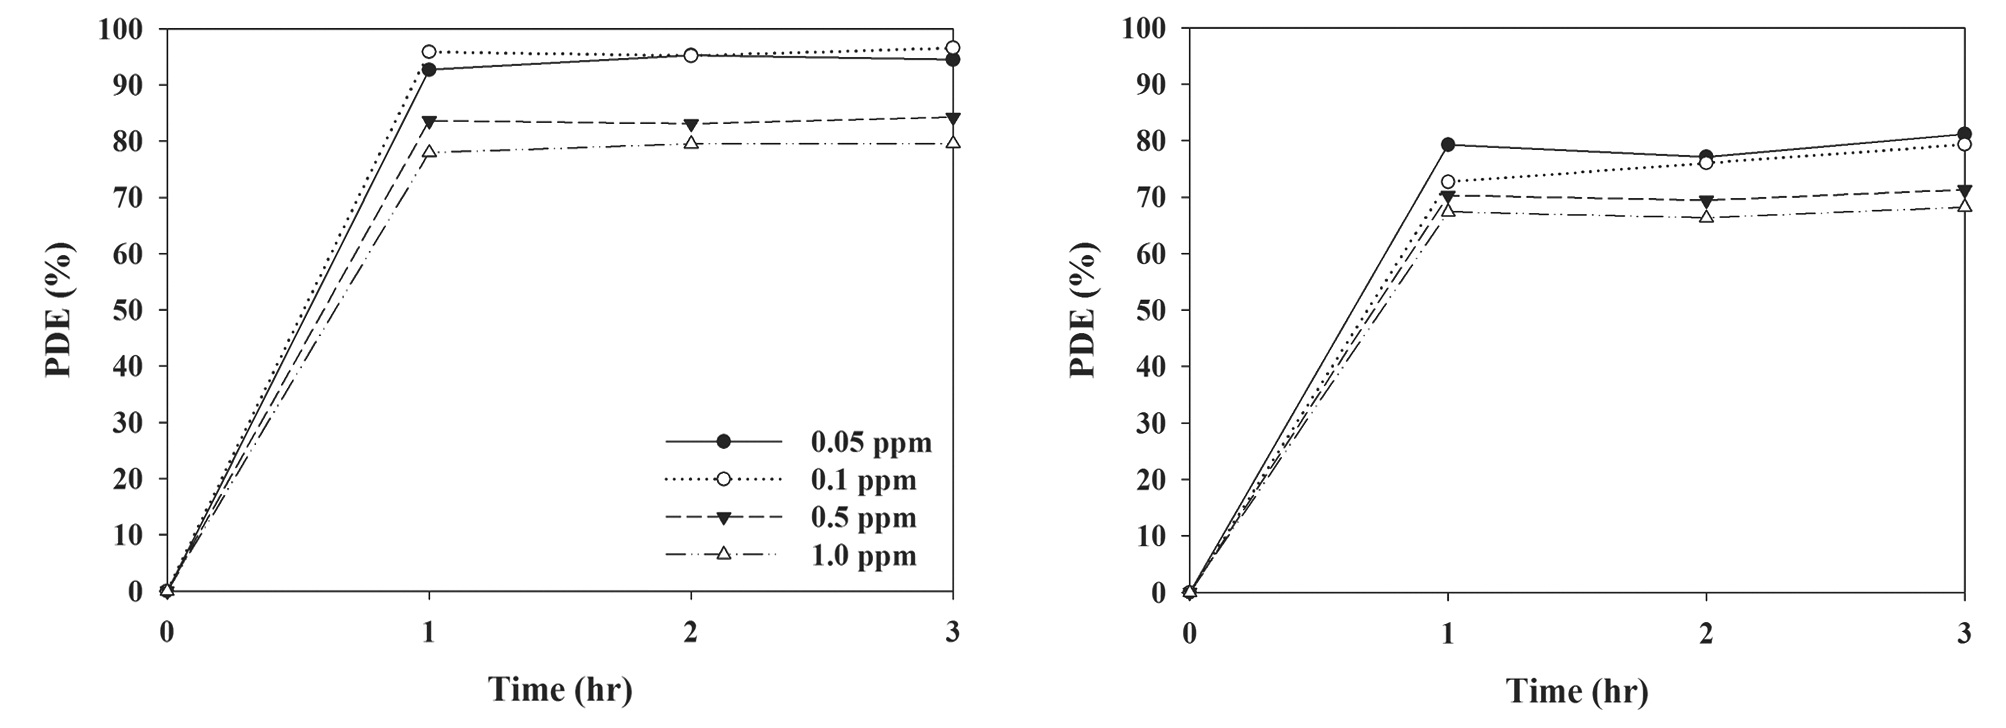
The effect of input concentration on the degradation efficiency
of TCE and PCE is presented in Fig. 6. Although the difference is not substantial, the degradation efficiencies exhibited a decreasing trend with increasing input concentrations. At the lowest input concentration (0.05 ppm), average degradation efficiencies for TCE and PCE over a 3-hr process were 94% and 79%, respectively, whereas at the highest input concentration (1.0 ppm) they were 79% and 67%, respectively. Several studies have reported similar trends for other compounds, such as NOx, as well as certain type of VOCs [24-26]. The input concentration dependence is attributed to adsorption competition between gas molecules for adsorption sites on the N-TiO2 surface. At higher input concentrations, the adsorption sites on the photocatalyst surface would be more limited for the adsorption of TCE and PCE molecules. Furthermore, this trend can be associated with the Langmuir-Hinshelwood (LH) adsorption isotherm model, which has been most widely utilized to describe the photocatalytic reaction rate of VOCs with input concentrations [27]. According to the LH model, the decreasing trend in degradation efficiency with the increase in input concentration suggests that the concentration range tested in the present study was within the intermediate regime, in which the photocatalytic oxidation rate increases slowly, but the degradation efficiency decreases, or the high regime, in which the photocatalytic oxidation is independent of input concentrations (zero-order reaction kinetics), but the degradation efficiency decreases.
3.4. Photocatalytic Degradation Efficiencies According to Stream Flow Rate
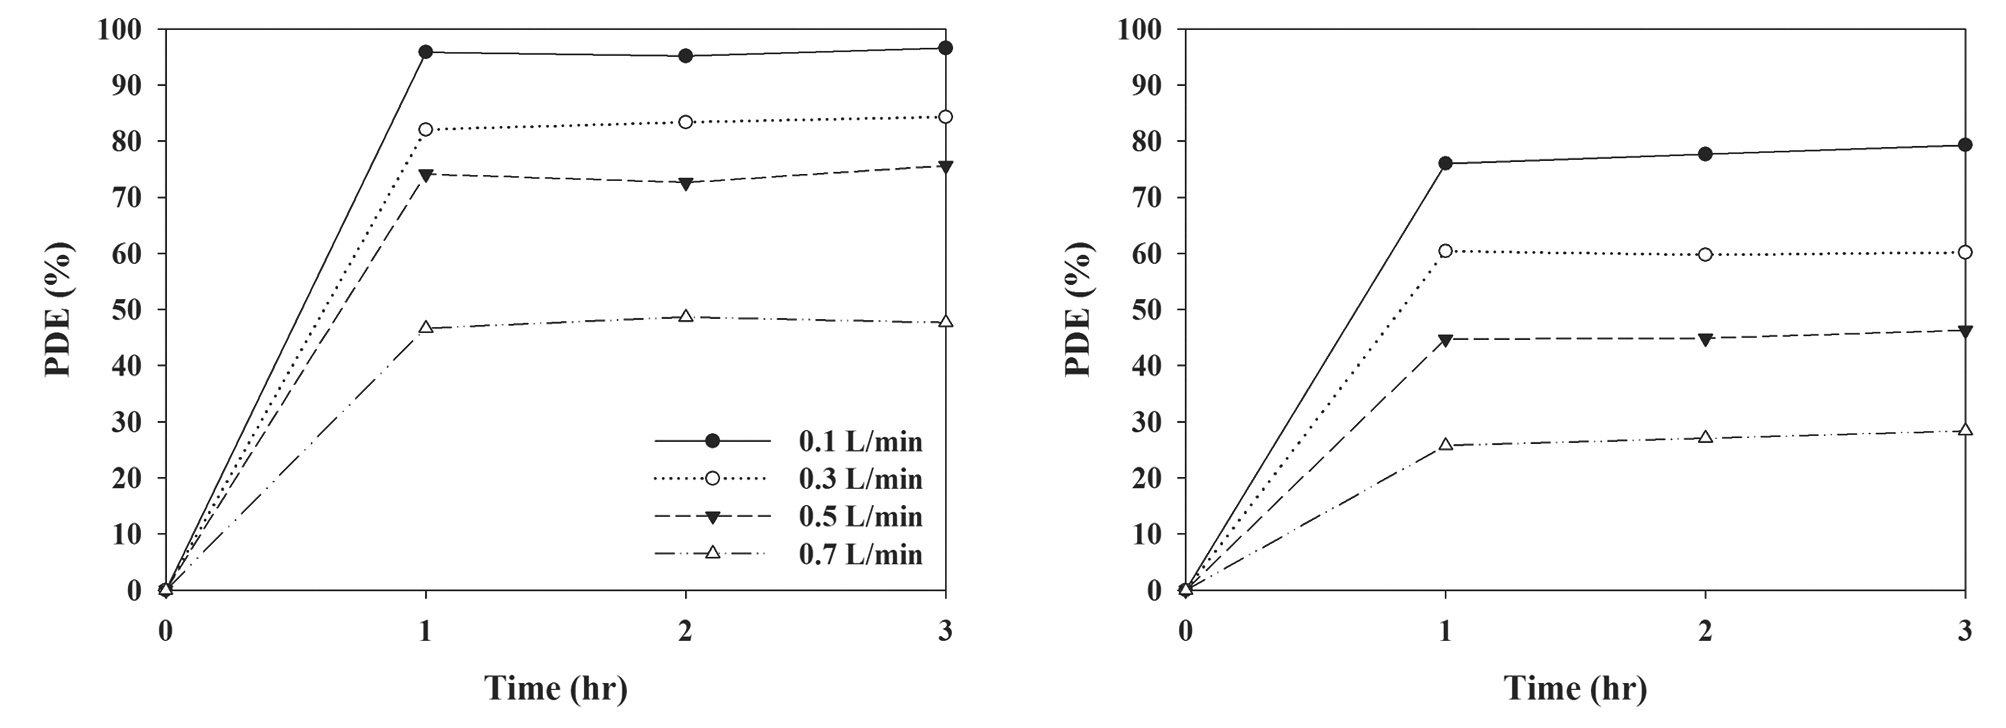
Fig. 7 reveals the photocatalytic degradation efficiency of TCE and PCE as determined using a LED-activated N-TiO2 photocatalytic system according to stream flow rate. The degradation efficiencies for TCE and PCE decreased with increasing air flow rates, which was similar to the results of other photocatalytic studies [28,29]. As the air flow rate was increased from 0.1 to 0.7 L/min, the average efficiencies for TCE and PCE decreased
from 96% to 48%, and from 77% to 27%, respectively, indicating that air flow rate was still an important parameter for the photocatalytic degradation mechanism of the N-TiO2 photocatalytic system. As air flow rate was increased, the bulk mass transport of target compounds from the gas-phase to the surface of the catalyst particle, which is an important heterogeneous catalytic reaction process, would be increased mainly due to convection and diffusion [25]. The Reynolds numbers for the flow rates of 0.1, 0.3, 0.5, and 0.7 L/min were 1.1, 3.3, 5.5, and 7.7, respectively. As such, the degradation rate would increase as air the flow rate was increased, indicating that MTBE degradation is limited to the TiC-350 surface. However, this pattern is in contrast to that determined in the current study. At higher air flow rates the gas retention time in the photocatalytic reactor would be too short to provide sufficient methyl tertiary-butyl ether (MTBE) transfer from the gas phase to the solid catalyst surface [25,30]. The gas retention times in the current study were 76, 25.3, 15.2, and 10.9 sec for air flow rates of 0.1, 0.3, 0.5, and 0.7 L/min, respectively, as determined by dividing the photocatalytic reactor volume by the air flow rate. Consequently, the lower efficiencies at higher air flow rates indicate that an insufficient reactor retention time effect would exceed the bulk mass transport effect on degradation of chlorinated compounds on the catalyst surfaces.
3.5. Photocatalytic Degradation Efficiencies According to Relative Humidity
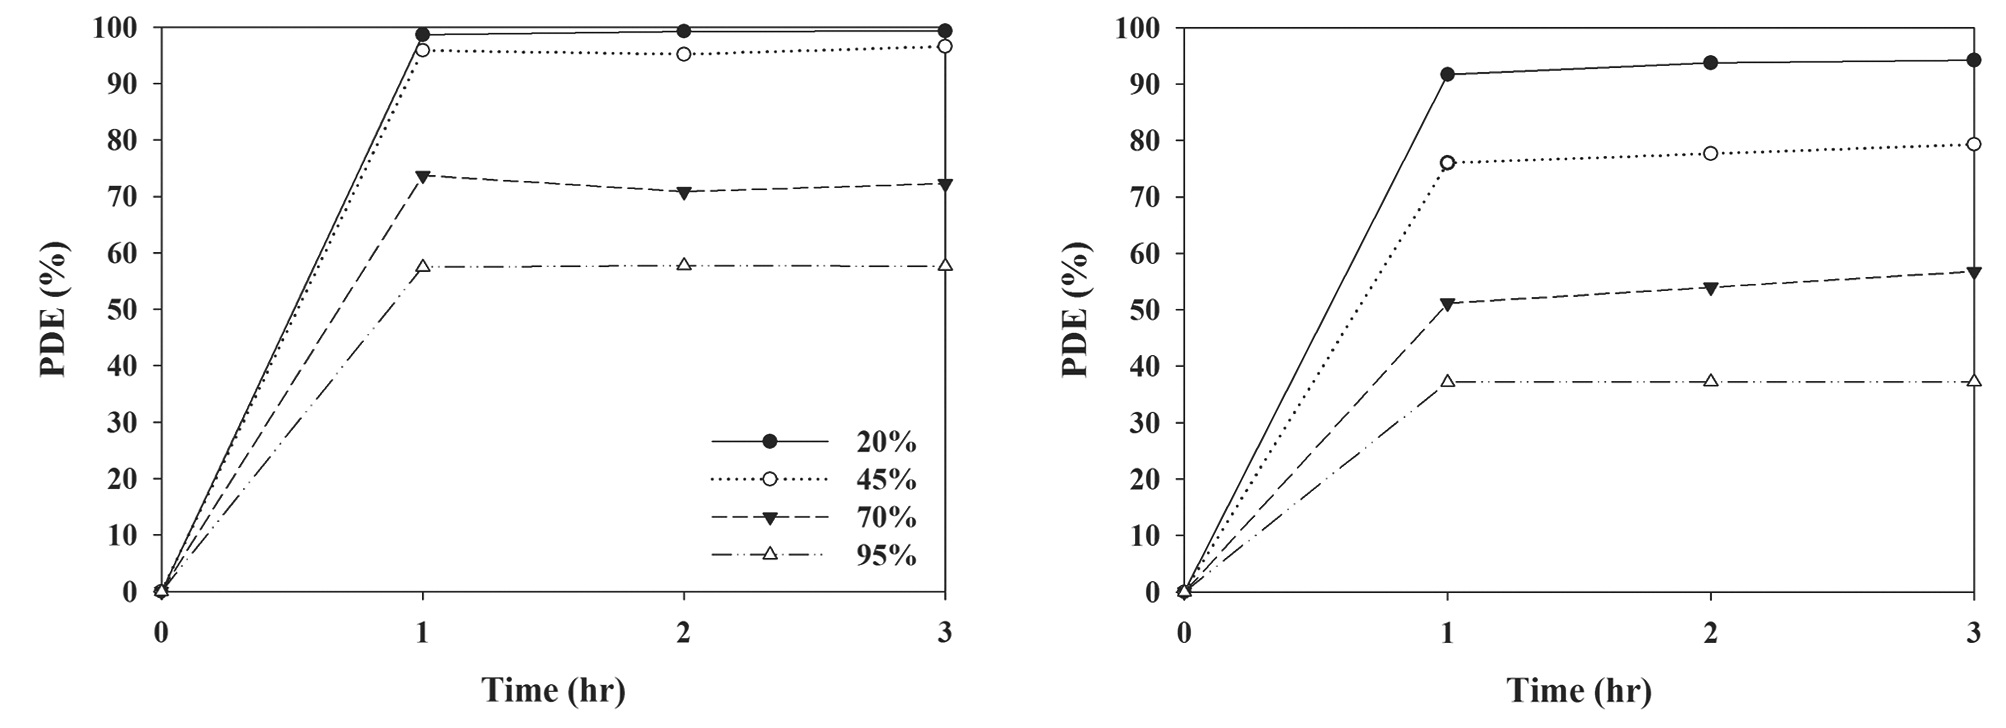
Fig. 8 exhibits the average degradation efficiencies for TCE and PCE determined over a 3-hr photocatalytic process under four different conditions of relative humidity, which cover typical ambient air humidity ranges. In general, the degradation efficiencies for both target compounds decreased as relative humidity increased. The average degradation efficiencies for TCE and PCE were 99% and 93%, respectively, under conditions of 20% relative humidity, whereas they were 58% and 37%, respectively, under conditions of 95% relative humidity. Moreover, at the relative humidity of 45%, which is within the human comfort range recommended by the American Society of Heating, Refrigerating and Air-Conditioning Engineers [31], the average degradation efficiencies for TCE and PCE were 96% and 77%, respectively. These findings were attributed to the effect of the hydroxyl radical availability on the catalyst surface, or on competitive adsorption between water and the TCE and PCE molecules on the photocatalyst surface [27]. The reduction in the removal efficiency determined at conditions of low relative humidity was ascribed to a decrease in the hydroxyl radical population, which is closely associated with initiating photocatalytic oxidation reactions on the catalyst surface [27]. Similarly, Ao et al. [24] used a TiO2-UV lamp system, and reported a descending trend in gaseous pollutant removal efficiencies with increasing relative humidity. However, this dependence of removal on humidity was inconsistent with that reported by Jo and Kim [26], who used another type of photocatalytic unit (S-TiO2-visible lamp system). Jo and Kim [26] reported no relative humidity dependency for the removal efficiencies of certain VOCs. Consequently, relative humidity dependency on gaseous pollutant removal appears to vary with different types of photocatalyst.
The present study examined the applicability of visible-light LEDs for the photocatalytic degradation of indoor-level TCE and PCE using N-TiO2 under a range of operational conditions. Moreover, it was also confirmed that different operational conditions could result in different photocatalytic performance. Specifically, the conditions of high calcination temperature and low input concentration, stream flow rate, and relative humidity were determined and optimized for the degradation of TCE and PCE. In addition, in contrast to the photocatalytic degradation efficiencies, the normalized photocatalytic degradation efficiencies for TCE and PCE for the violet LED-irradiated N-TiO2 system were higher than those from the 8-W fluorescent daylight lampirradiated N-TiO2 system. Consequently, these findings confirm that violet LEDs can be utilized as energy-efficient light sources for the photocatalytic degradation of TCE and PCE, especially if the operational conditions of the N-TiO2 photocatalytic system are optimized.