In the planning and management of water resources, there have been numerous studies on the sensitivity of streamflow to climate, in particular, to changes in rainfall and potential evapotranspiration. Most of the studies include rainfall elasticity. Rainfall elasticity was first introduced by Schaake [1] to assess the effects of climate on streamflow. In most of the previous studies on rainfall elasticity, hydrological models are used to assess the effects of climate change. Where 1) observed streamflow data were used to calibrate the parameters of the model; 2) the input rainfall data are modified to reflect climate change; 3) the model is run using the modified input data and the calibrated parameter values; and 4) the simulated streamflow is compared against the historical streamflow to provide an estimate of the climate change impact on streamflow [1-4].
There are not many previous studies for rainfall elasticity, but they can be summarized as follows: Schaake [1] proposed an elasticity index to assess the sensitivity of streamflow as rainfall changes. The index varied depending on the applied model, parameters, or estimator. Nash and Gleick [5] used the National Weather Service River Forecast System (NWSRFS) to evaluate rainfall elasticity of the Animas River, a tributary of the Colorado River, in the United States. In this paper, it is proposed that if annual rainfall increases by 10%, annual streamflow would increase by 10.9%. Schaake [1] applied the same hydrologic model to the same basin, however, the result was different from the proposal as annual precipitation increased by 10% while streamflow increased by 19.7%. In addition, in other studies using the multivariate regression model, streamflow increased by 10.5% [6] and 19.0% [7], and the results were different from the result of Schaake [1]. Sankarasubramanian et al. [8] proposed a new index where the concepts of a median and a mean value are applied to resolve problems caused by the estimation of hydrologic models or parameters. This index quantifies the variations of annual data on mean values. It is known to present values, which are both easy to calculate and reliable [9-11].
In this paper, the SLURP model, a semi-distributed hydrological model was used to simulate the variations of area l rainfall, area streamflow, and potential evapotranspiration. Then, a nonparametric method was used to estimate rainfall elasticity on 5 river basins of Korea. In this study, using the A2 scenario is regionalization, emphasis on human wealth Regional, intensive (clash of civilizations). The A2 storyline and scenario family describes a very heterogeneous world. The underlying theme is self-reliance and preservation of local identities. Fertility patterns
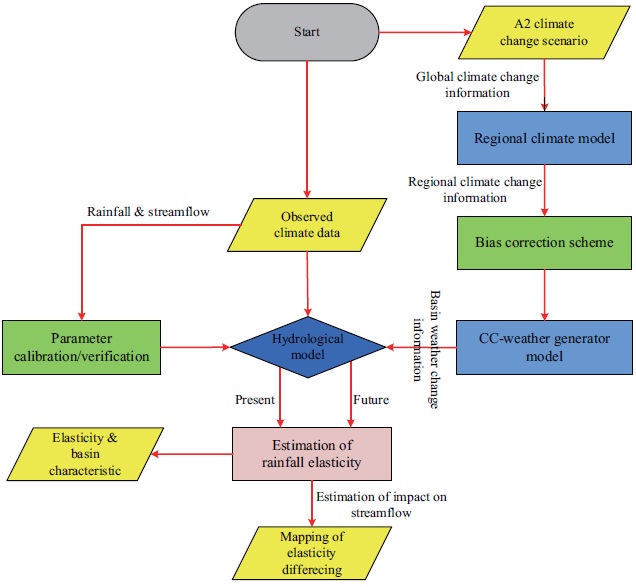
across regions converge very slowly, which results in a continuously increasing global population. Economic development is primarily regionally oriented and per capita economic growth and technological change are more fragmented and slower than in other storylines. In addition, the A2 climate change scenario and stochastic downscaling technique were used to create a high-resolution weather change scenario in river basins, and the effects of climate change on the rainfall elasticity of each basin were then analyzed. Furthermore, a rainfall elasticity map for each basin was created and compared with that of the present and the future. Fig. 1 shows the methodology and a flowchart.
2.1. The Nonstationary Markov Chain Models
This study was intended to use regional climate model (RCM) which is a dynamical-based downscaling model which focuses on the SRES A2 climate change scenario. Dynamical-based model outputs typically contain some systematic bias and require correction. Quantile mapping is considered here for bias correction of the monthly RCM precipitation data, and is based on two cumulative distribution functions (CDF). Each CDF for observation and RCM precipitation is fit with a gamma distribution and saves the shape and scale parameters. A given monthly RCM precipitation data is then biasedly corrected by mapping it from the corresponding month RCM CDF to the observed CDF [12-14].
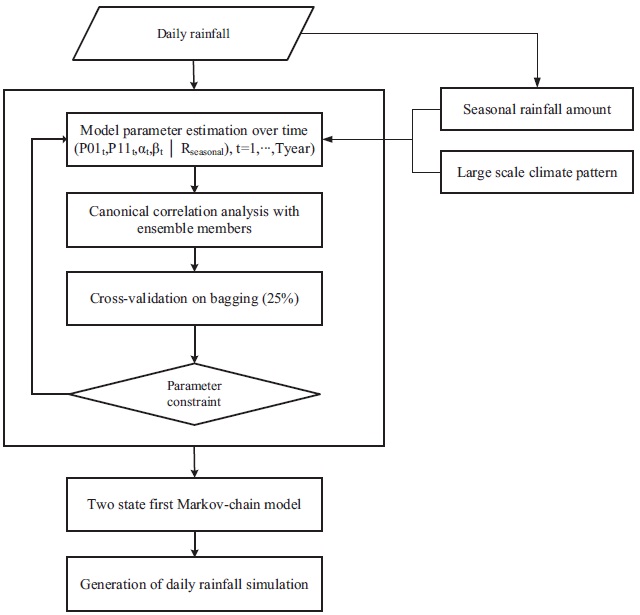
The hydrological model for assessing the impact of climate change on water resources usually requires daily hydrological data. In this regard a statistical downscaling model utilizing climate change scenarios as inputs was employed. Statistical downscaling models inherently account for biases by their empirical nature and can be used to disaggregate monthly rainfall into a daily scale. Rainfall occurrence can be defined by a 2-state first order Markov chain model that uses conditional probability on the previous day. Two transition parameters (
Many hydrological models have been developed and applied for analysis and evaluation of the hydrologic cycle. Therefore, strengths and weaknesses of each model have to be considered to select the most appropriate model that meets purposes for target basins [15]. To analyze impacts on water resources in target basins considering climate change, changes in physical characteristics such as evaporation, and land cover change have to be assessed by geographical information system (GIS) in addition to long-term runoff simulation taking into account a climate change scenario.
Considering this, it has been already confirmed by previous studies that the PRMS, SLURP, and SWAT models are applicable to the river basins of Korea [16,18]. Models will be described briefly. The precipitation-runoff modeling system (PRMS) is a deterministic, distributed-parameter, physical process based modeling system developed to evaluate the response of various
combinations of climate and land use on streamflow and general watershed hydrology. Soil & water assessment tool (SWAT) is a river basin scale model developed to quantify the impact of land management practices in large, complex watersheds. It is a hydrology model with the following components: weather, surface runoff, return flow, percolation, evapotranspiration, transmission losses, pond and reservoir storage, crop growth and irrigation, groundwater flow, reach routing, nutrient and pesticide loading, and water transfer. Also, SWAT can be considered a watershed hydrological transport model. Finally, semidistributed land use-based runoff processes (SLURP) is a basin model which simulates the hydrological cycle from precipitation to runoff including the effects of reservoirs, dams, regulators, water extractions/diversions and irrigation schemes. The model may be used to examine the effects of proposed changes in water management within a basin or to see what effects external factors such as climate change or changing land cover might have on various water users. In this paper, the SLURP model was selected because it has advantages in acknowledging changes in factors for climate change, including multiple dams, land cover, and vegetation.
The SLURP model is a daily hydrological model, and uses physiographical parameters, time-series data, and physical parameters as input data. For the streamflow simulation of the SLURP model, the vertical water balance of each small basin called aggregated simulation area (ASA) is analyzed, and the river channel routing of each ASA is performed to obtain the streamflow at the outlet of the basin [18].
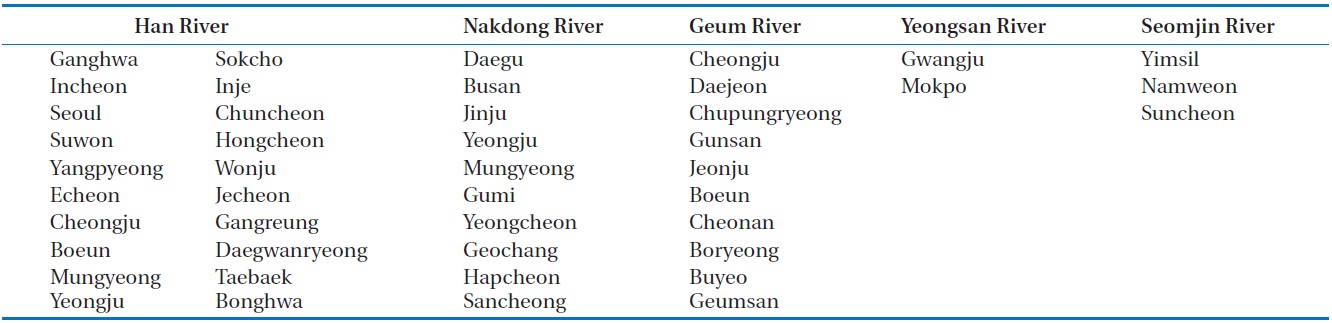
[Table 1.] Meteorological observation stations on 5 river basins

Meteorological observation stations on 5 river basins
2.3. Nonparametric Rainfall Elasticity
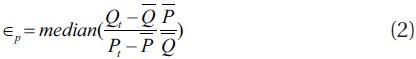
Schaake [1] adopted the concept of elasticity as shown in Eq. (1) to evaluate the sensitivity of streamflow for climate. The method has a weakness of having different results depending on applied models and parameters for estimating the streamflow. Sankarasubramanian et al. [8] proposed a new index in which concepts of a median and a mean value are applied as shown in Eq. (2), and named it a nonparametric method. This index quantifies the variations of annual data on mean values [9-11].
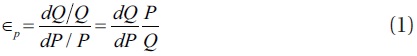
Where,

are the mean annual rainfall and streamflow, respectively.
3.1. Basins and Data Collection
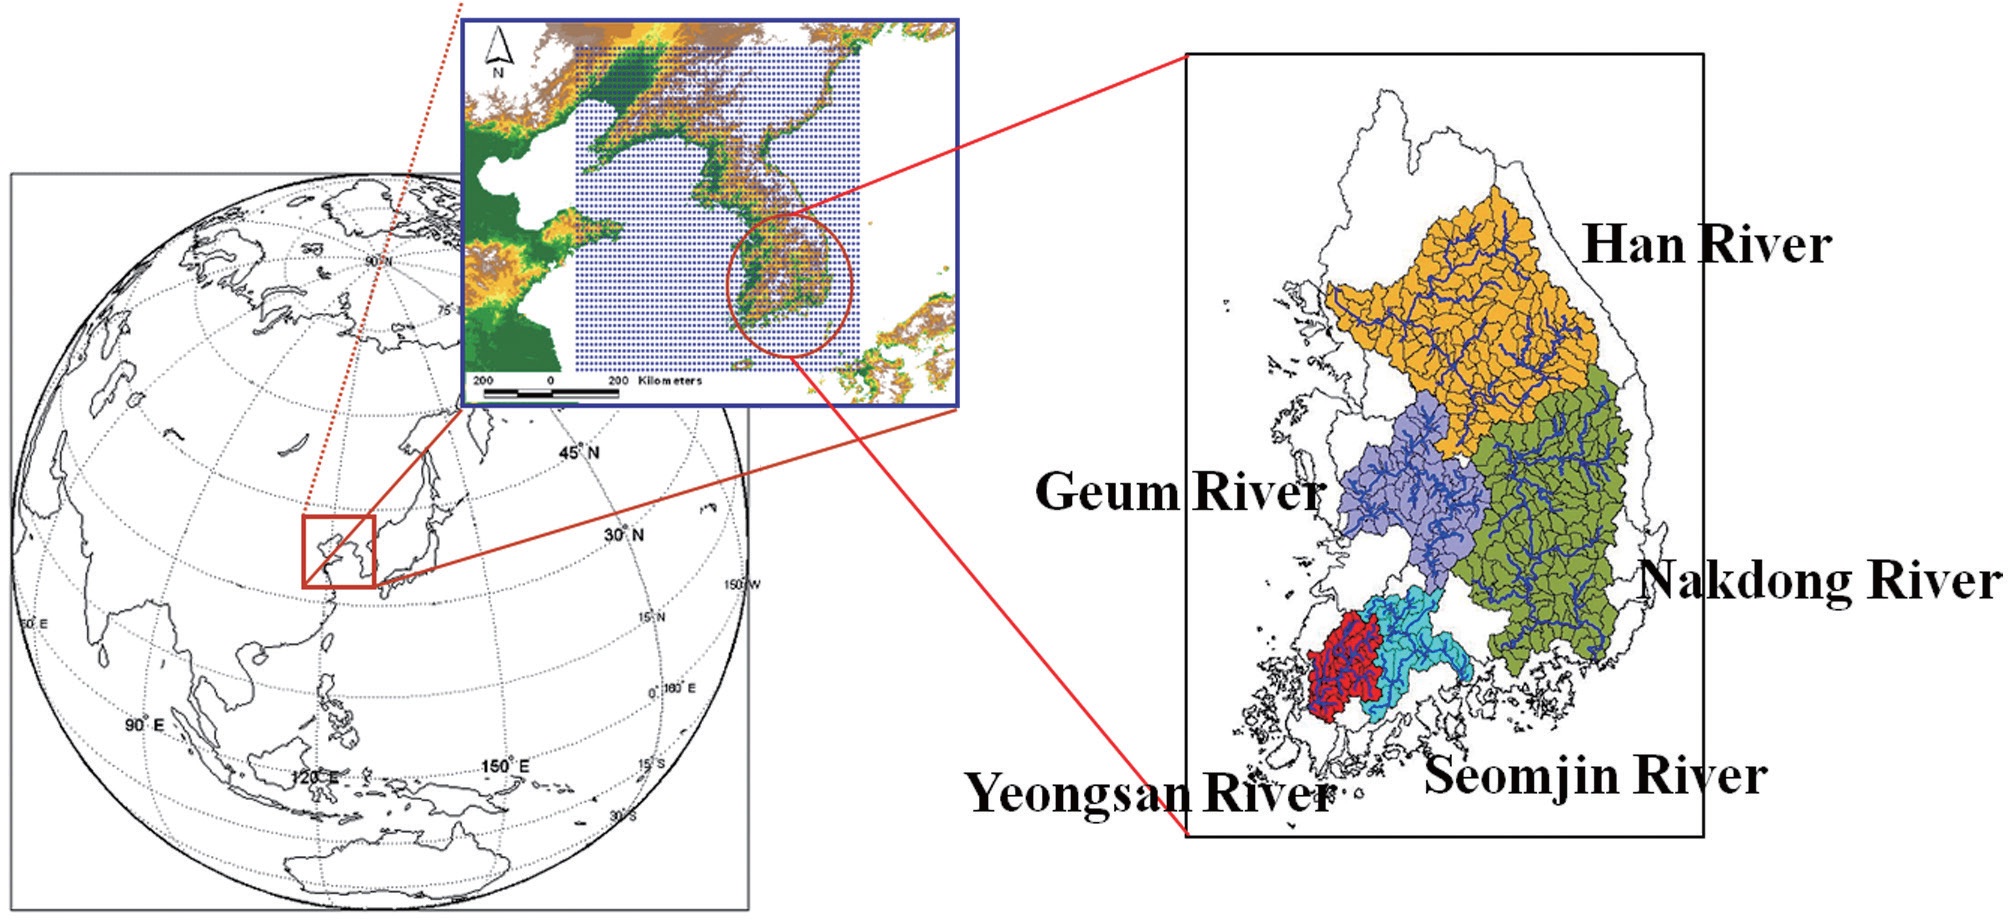
In this paper, 45 meteorological observation stations on five river basins were selected, and weather data from 1973 to 2006 were collected. Table 1 illustrates the current status of weather observations on each river basin used in this paper and the five river basins are shown in Fig. 3.
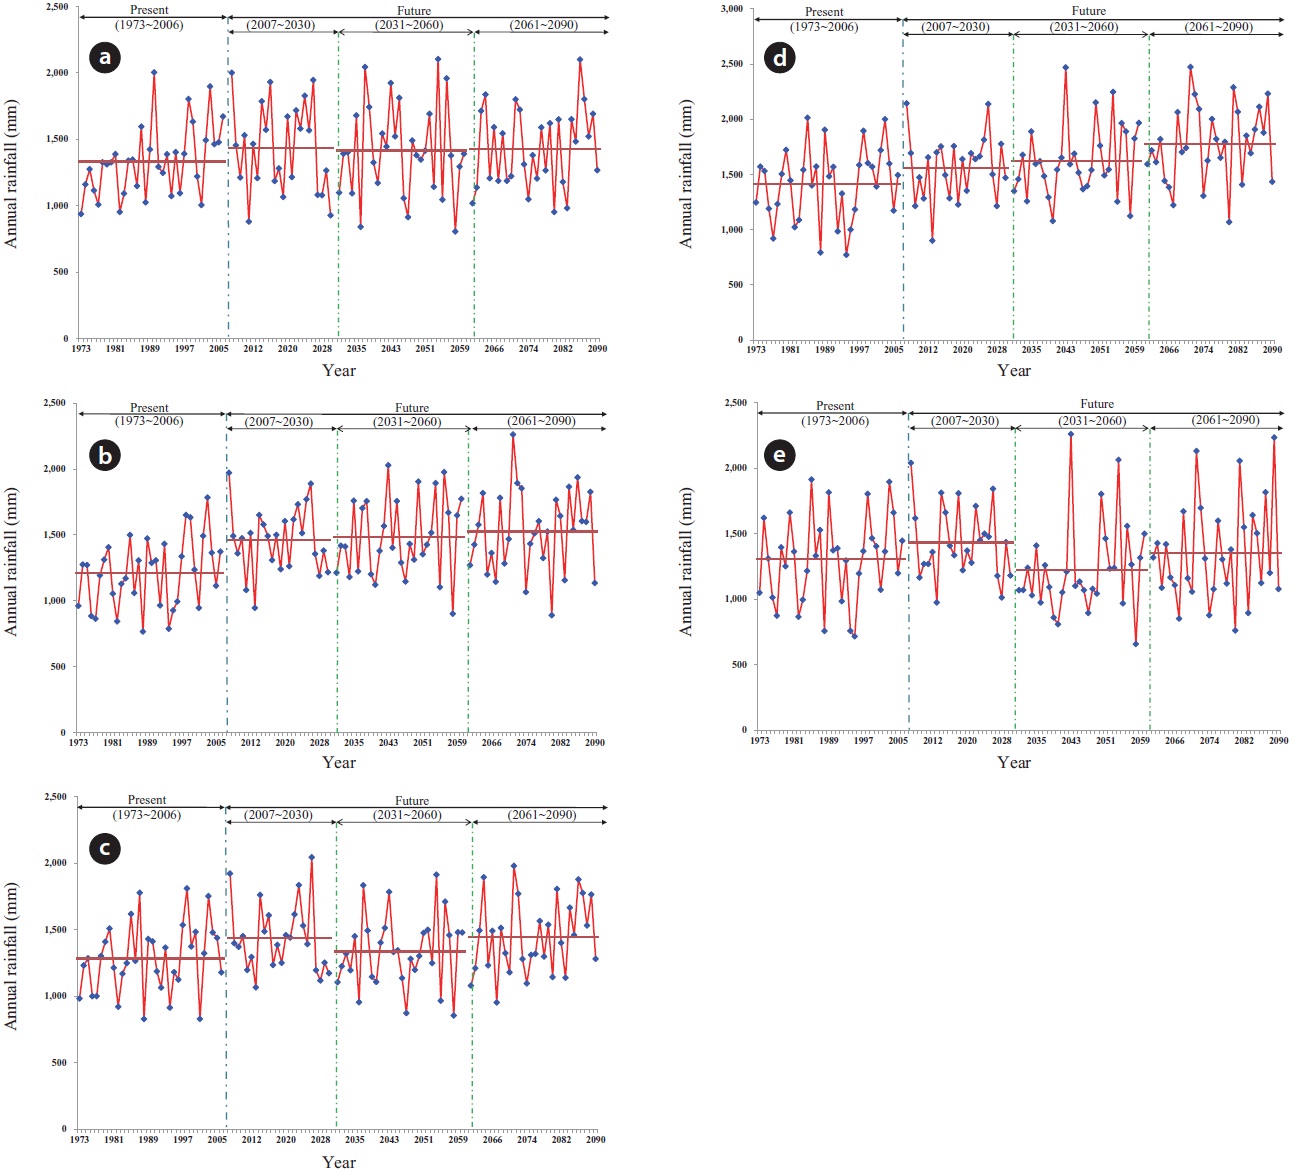
3.2. The Impact of Climate Change on Annual Rainfall
The effect of climate change on rainfall in the basins was analyzed using the A2 climate change scenario. The variation of rainfall in comparison to the present (1973 to 2006) was analyzed. It
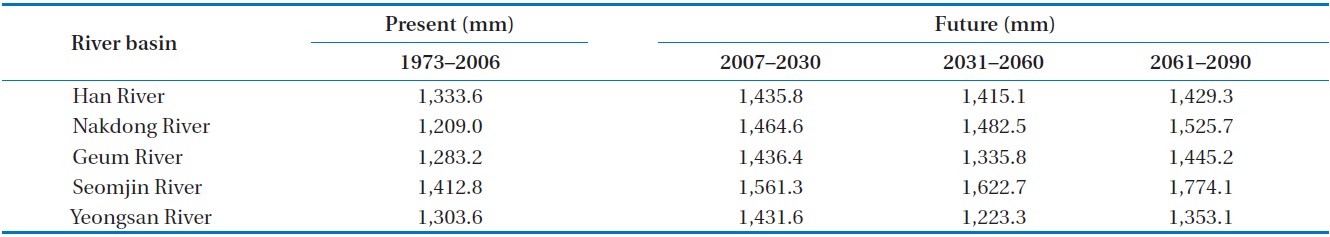
[Table 2.] Mean annual precipitation fluctuation

Mean annual precipitation fluctuation
was simulated that rainfall increased by 7.66% from 2007 to 2030 (2015) compared to the present, 6.11% from 2031 to 2060 (2045), and 7.18% from 2061 to 2090 (2075) on the basin of Han River. In addition, annual mean rainfall tended to increase. The results of the analysis were as follows in Table 2 and Fig. 4.
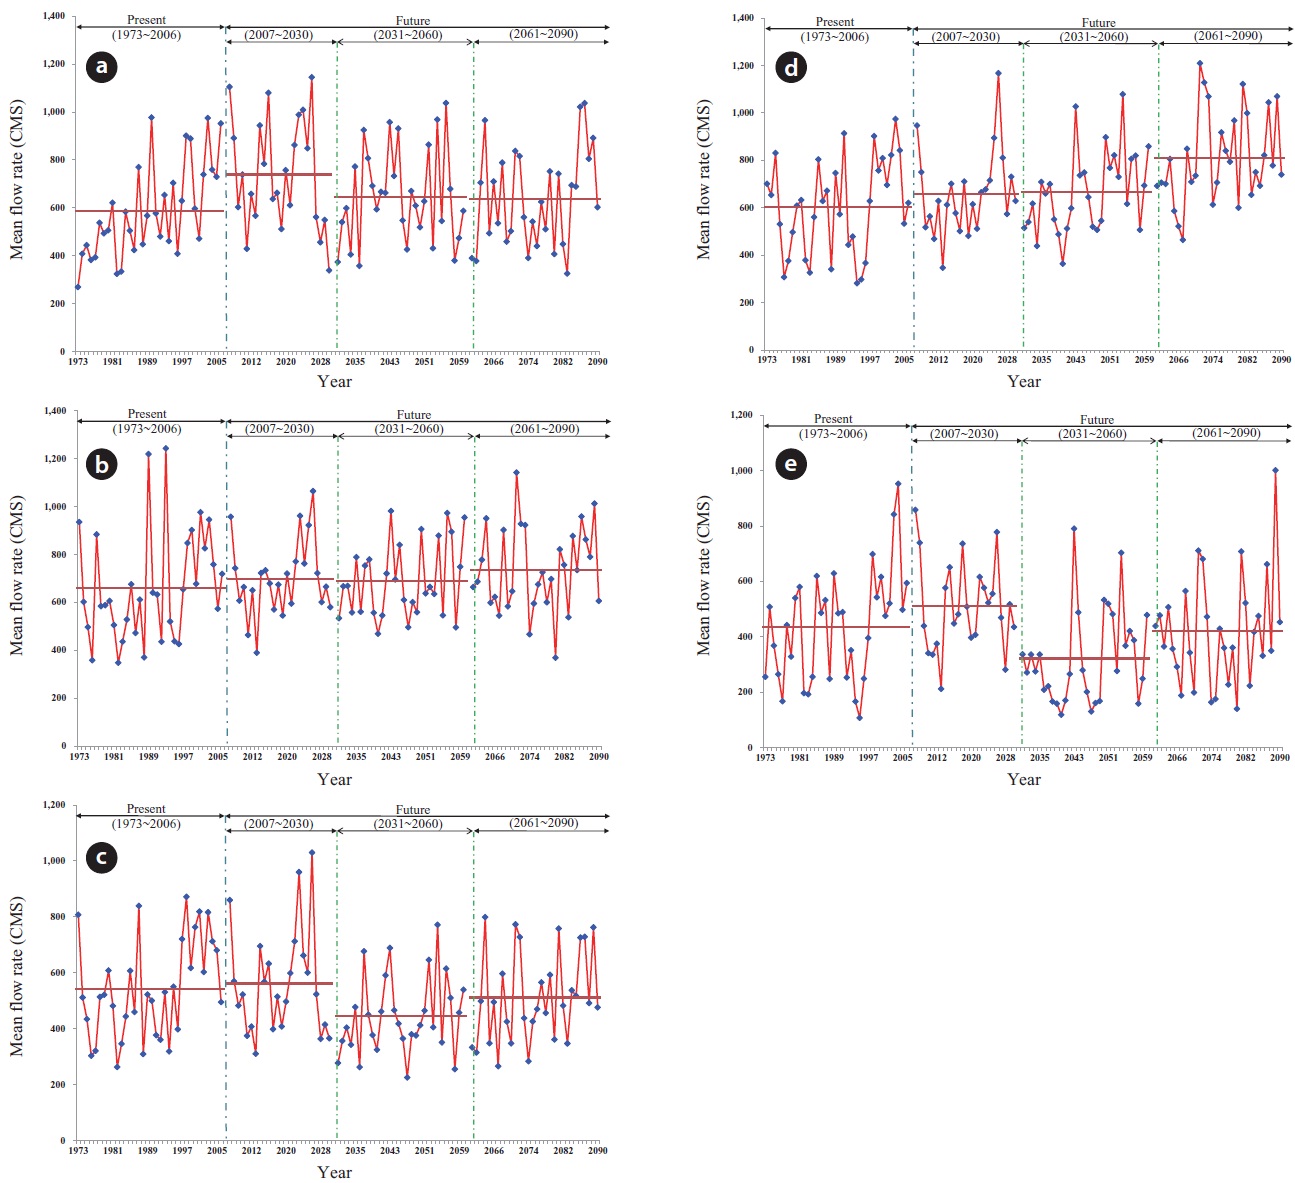
3.3. The Impact of Climate Change on Annual Streamflow
In order to analyze the variation of streamflow on five river basins in Korea, the SLURP model, a semi-distributed hydrological model, was used to divide the basins of Han River into
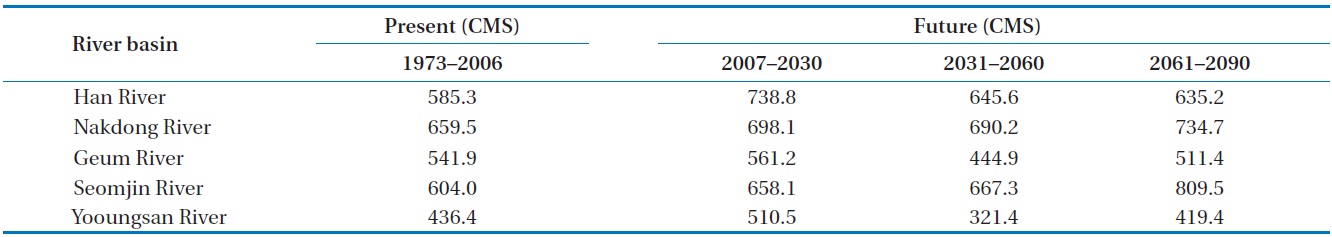
[Table 3.] Mean annual flow fluctuation

Mean annual flow fluctuation
139 ASA small basins, those of Nakdong River into 149, those of Geum River into 63, those of Seomjin River into 25, and those of Yeongsan River into 29. The results of the analysis were as follows in Table 3 and Fig. 5.
3.4. Estimation of Rainfall Elasticity
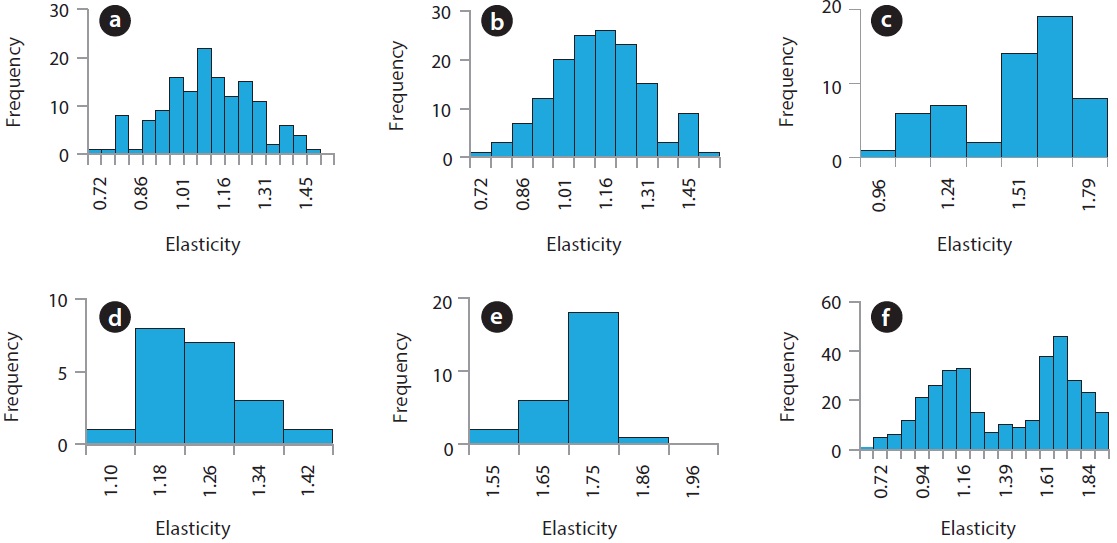
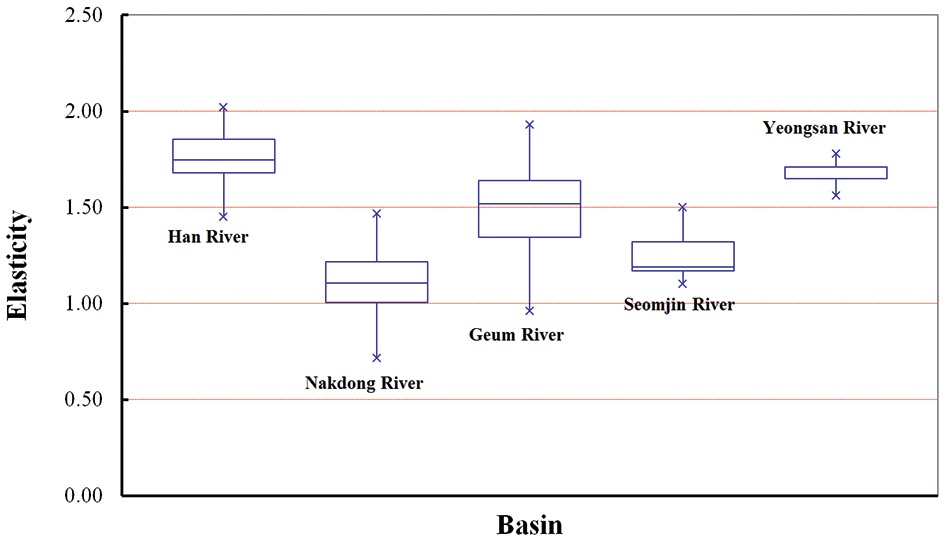
The mean value, standard deviation, mode, distribution, and quartile range of rainfall elasticity on five river basins in Korea were estimated (Table 4). Fig. 6 illustrates the distribution of elasticity on each river basin and Fig. 7 illustrates comparison of boxplot for elasticity.
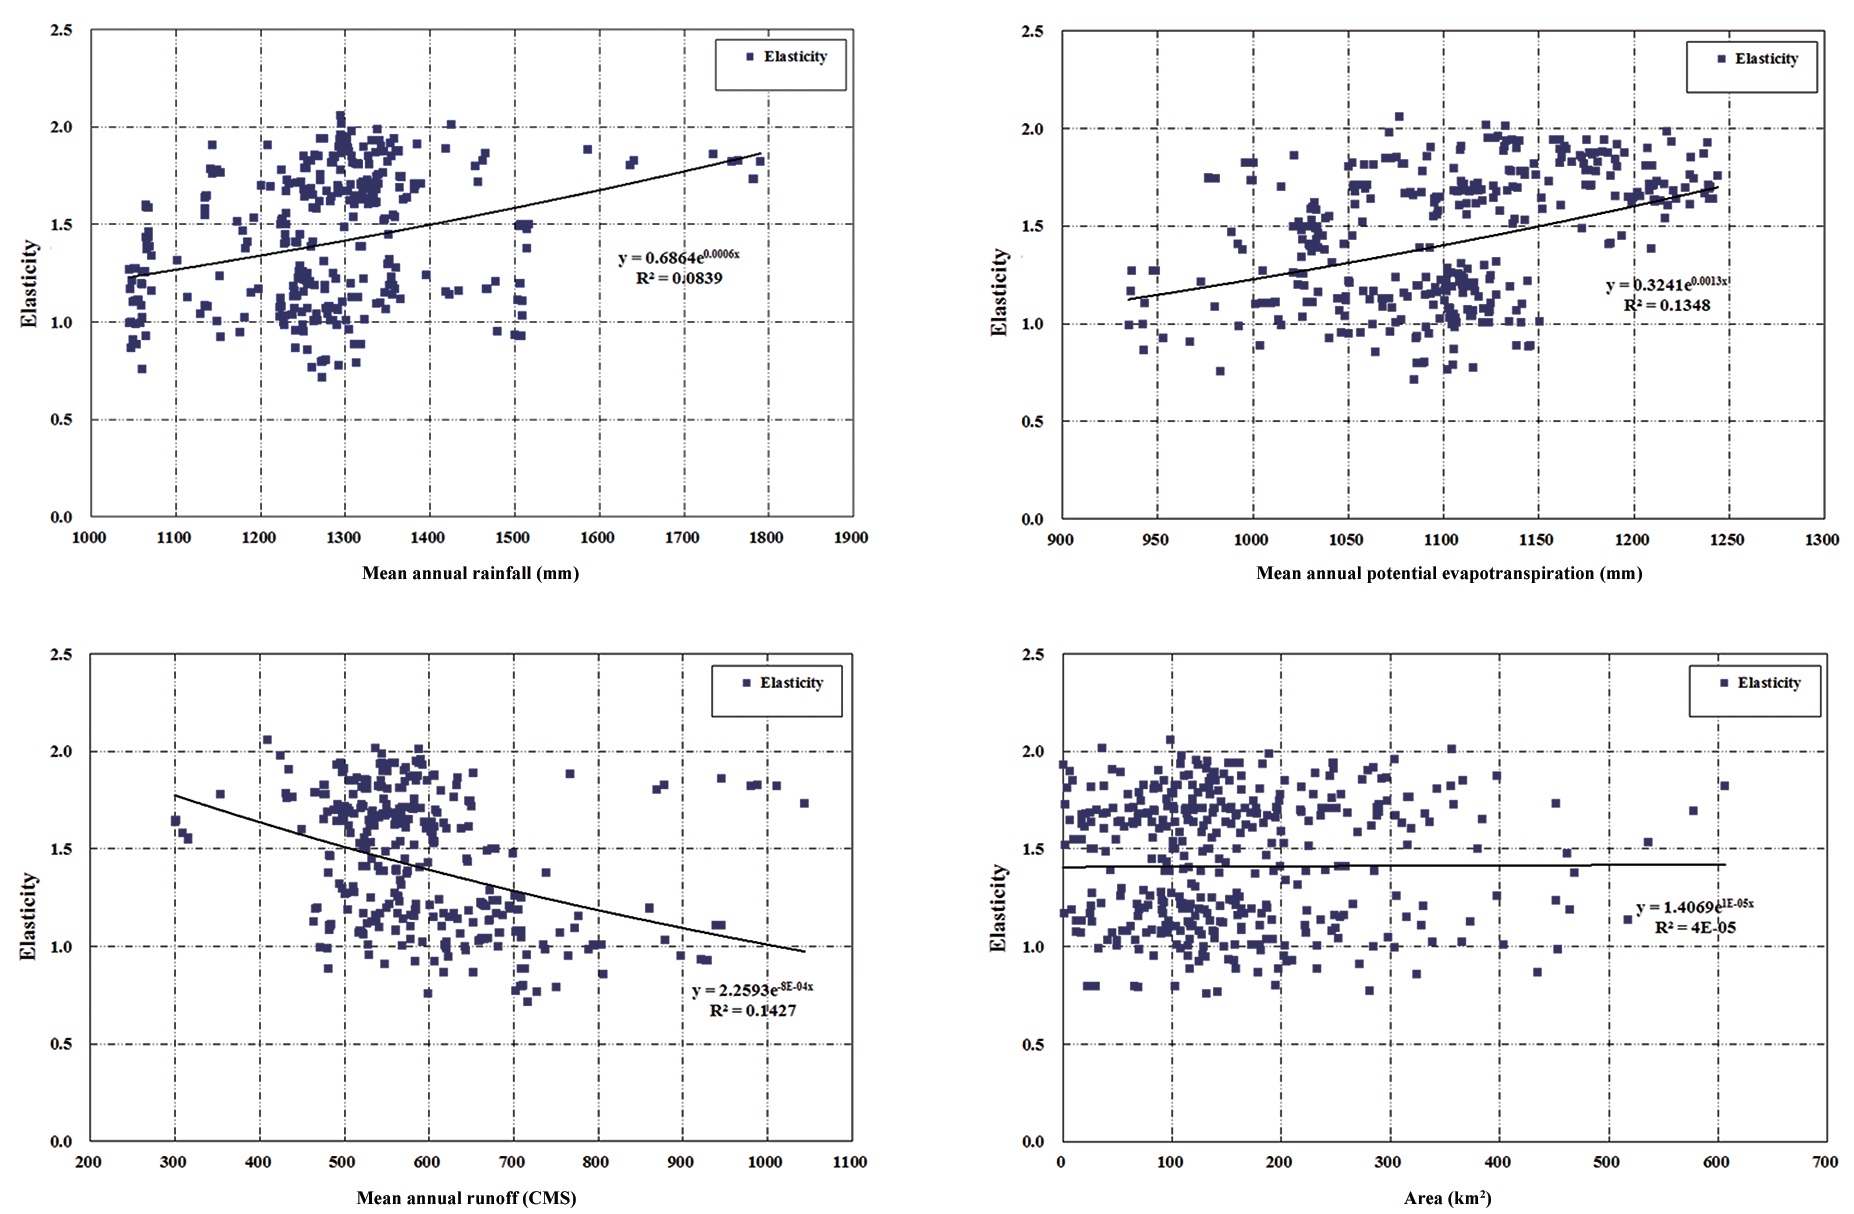
As a result of analyzing correlations between annual mean rainfall, potential evapotranspiration, streamflow, and area it turned out that as rainfall or evapotranspiration got higher, the
[Table 4 .] Comparison of statistics for rainfall elasticity
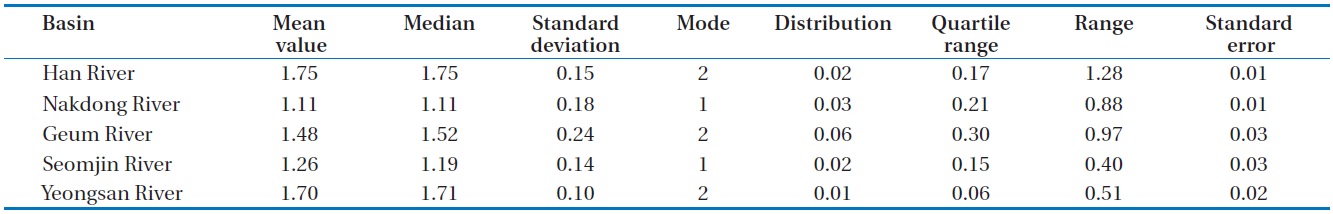
Comparison of statistics for rainfall elasticity
value of elasticity and streamflow increased, and that of elasticity decreased. In addition, it turned out that area, a geomorphic variable, did not significantly affect elasticity. Fig. 8 show that the elasticity relative with catchment characteristics such as rainfall, evapotranspiration, stream flow, and area.
3.5. Effects of Climate Change on Rainfall Elasticity on Each Basin
The elasticity of 5 river basins was graded to assess the effects of climate change on rainfall elasticity on the basins. It is important in degrading elasticity to develop a methodology that comprehensively analyzes the elasticity with different levels depending on basins. As for the methods for grading elasticity, standardization and min-max standardization have been used. However, since these methods analyze the characteristics of existing data by limiting the data to a specific distribution or interval, they might do damage to the characteristics of data. In this regard, kernel density estimation was adopted in order to define the series of data with probability density functions ranging from 0 to 1 without assuming probability distribution.
3.5.1. Grading using nonparametic kernel density functions
Since the information concerning the distribution of the population group, which is the examination object, is insufficient, methods for statistical reasoning by the analysis of statistics
without impossible or accurate premises are required. These are called nonparametric methods. In traditional methods for estimating parametric probability distribution, objectively selecting one probability distribution function is the most difficult. In addition, since parameters for data in short records and distorted data cannot ensure reliability and several other causes exist, it is difficult to estimate parametric probability distribution from data with density functions of mixed distribution in traditional methods. Nonparametric kernel density function analysis methods may induce distribution from observation data themselves without a need for the premise of distribution, the methods can resolve difficulties in selecting a distribution type, and select an appropriate distribution type for observation data. Thus, a nonparametric analysis method that suggests an appropriate probability value consistently will be effective for grading elasticity.
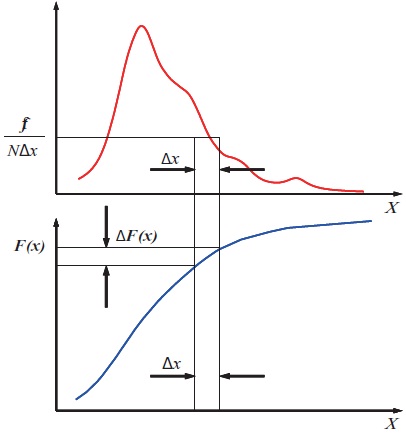
A bar graph is the basic concept of the kernel density function estimator and is a traditional method. It is the most commonly used probability density function estimator. Another important factor in the probability density function method using bar graphs is the setting of class interval. Depending on the size of class interval, the setting result may vary. While it is easy to understand bar graphs and to calculate them manually, bar graphs are discontinuous due to the variations of class interval and the shape of probability density functions varies depending on the selection of a start point in class interval and graphs. Thus, the bar graph method is very inefficient in terms of integrated mean squared error (IMSE). Although an ideally identical class interval is used, very different results of probability density functions may be obtained from the same data depending on the location selection of a start point. Thus, in order to resolve the weaknesses of bar graphs, Rosenblatt [19] developed a variable bar graph in which class interval moves and the point of each datum is located at the center of class interval. This variable bar graph is known as the current kernel density function method.
Rosenblatt [20] developed a kernel density function estimator using a shift histogram, which enables the location of the center of a bar graph to each location of data creation and the shift of class interval. He defined the actual number as Formula (3):
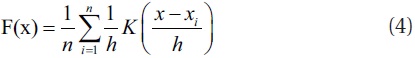
In this formula, xi are actual observation values distributed independently and evenly, K (formula) is the kernel function, and h is the positive bandwidth value. In this paper, a simple rule of thumb was used to estimate the bandwidth.

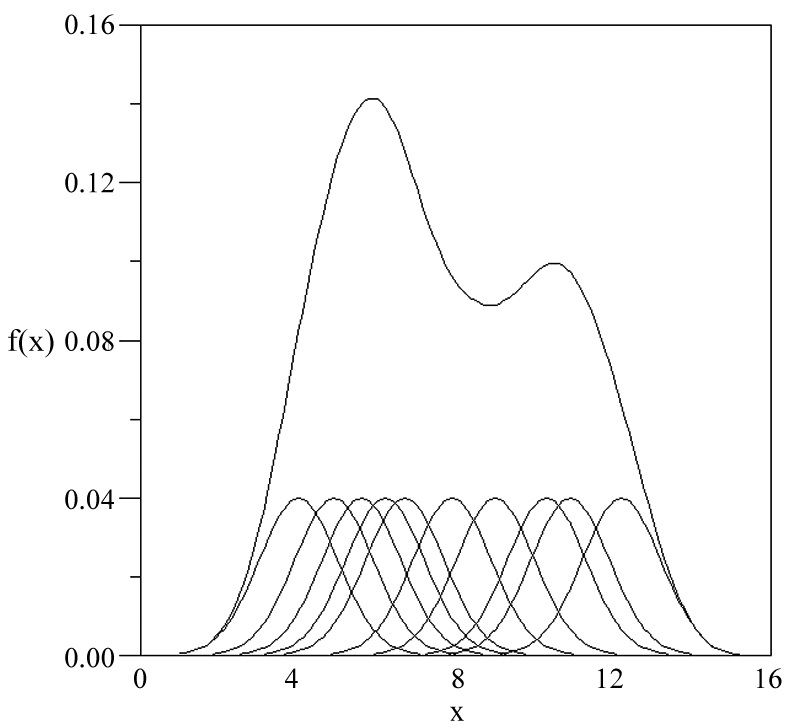
Fig. 9 is the total of kernel functions by locating them to the observed data locations. The total is shown in a probability density function. Fig. 9 illustrates a kernel density function using a kernel function whose number of observation data is 10 and whose bandwidth is 1.
The aforementioned kernel density function estimator has a consistent value without the variations of bandwidth, thus, it is called the fixed kernel density function estimator. The procedures for grading elasticity using kernel density functions are as follows:
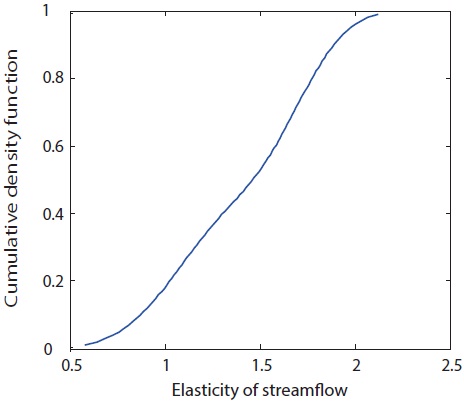
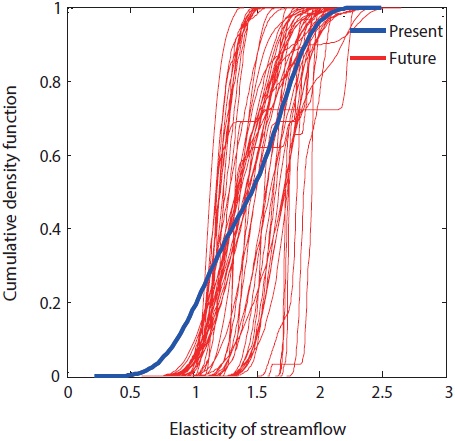
First, create data on the elasticity of each basin regardless of small basins from data on the five river basins of the present (1973 to 2006). Secondly, apply a kernel density function to the entire data on elasticity, and convert elasticity into an accumulated kernel density function (Figs. 10 and 11).
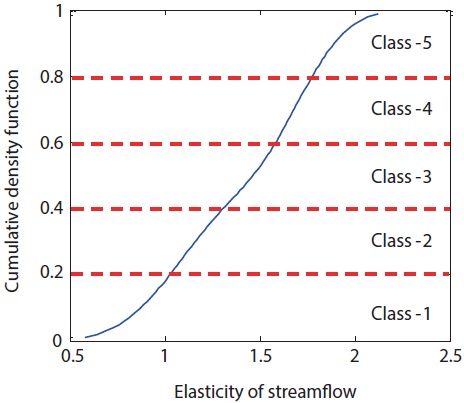
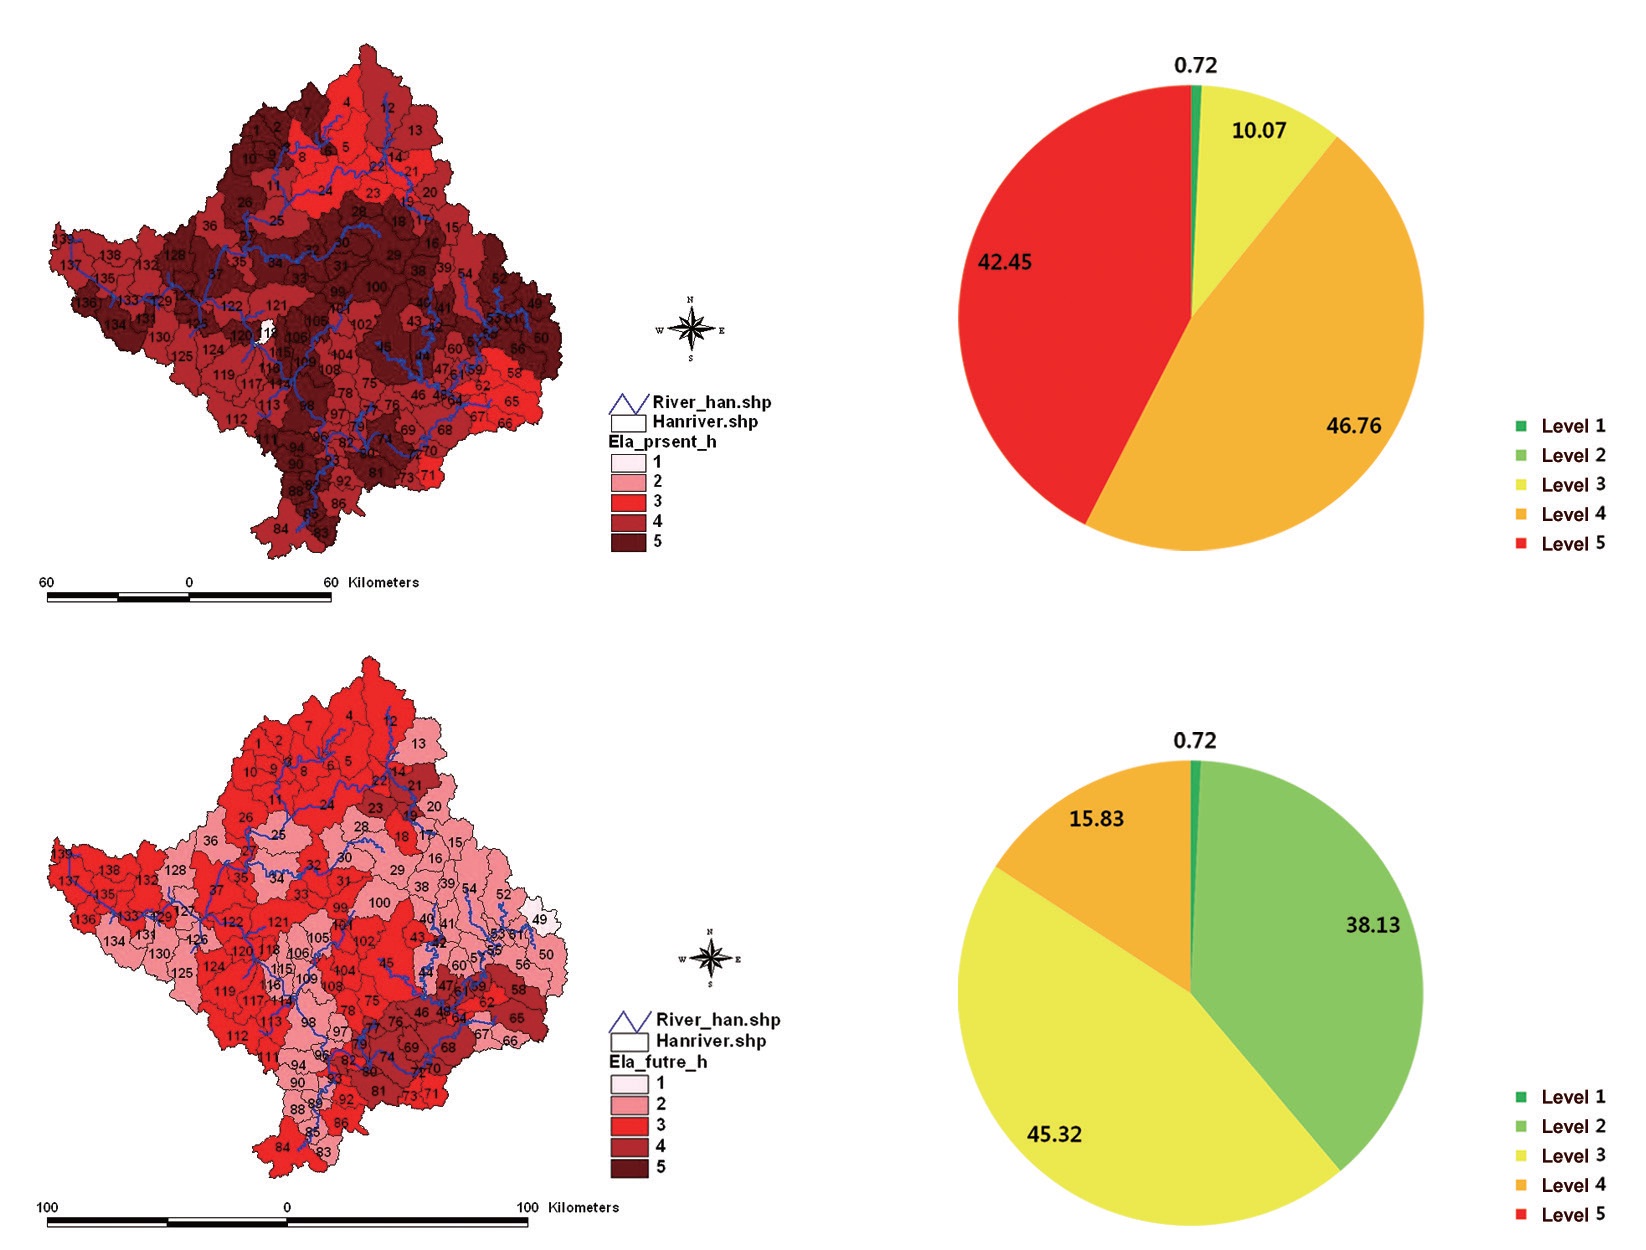
Thirdly, estimate the elasticity for each small basin of the five river basins from the accumulated kernel density function estimated from the past data on the five river basins as shown in Fig. 11, and convert the result into probability ranging from 0 to 1 (Figs. 12 and 13). Fourthly, the accumulated probability of each small basin estimated in step 3 is categorized into five levels. That is, categorize the probability interval from 0 to 1 into five levels (0?0.2, 0.2?0.4, 0.4?0.6, 0.6?0.8, 0.8?1.0) and compare them to the accumulated probability estimated on each small basin. Finally, grade each small basin.
3.5.2. Comparison between current elasticity and future one
In order to examine how elasticity fluctuates due to climate change scenarios in comparison to the present, the current elasticity value was compared to elasticity considering the climate change in each zone.
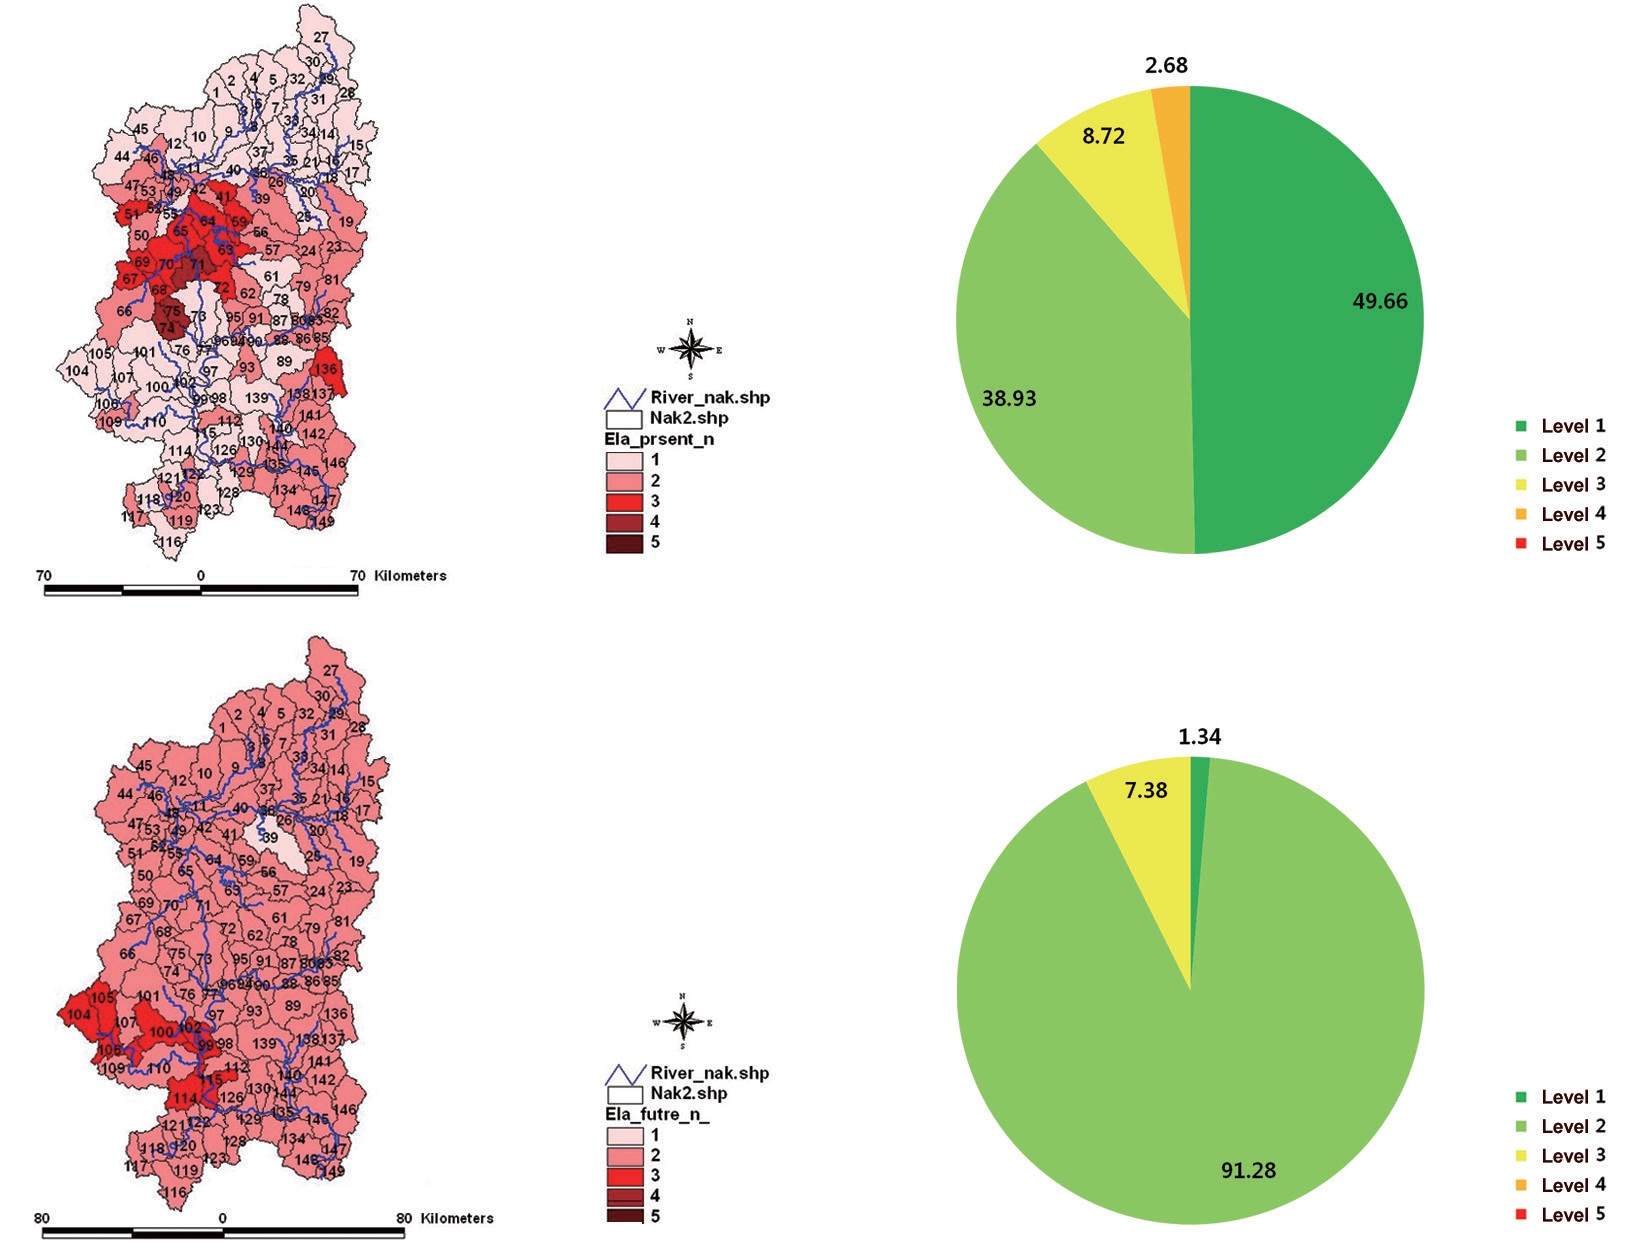
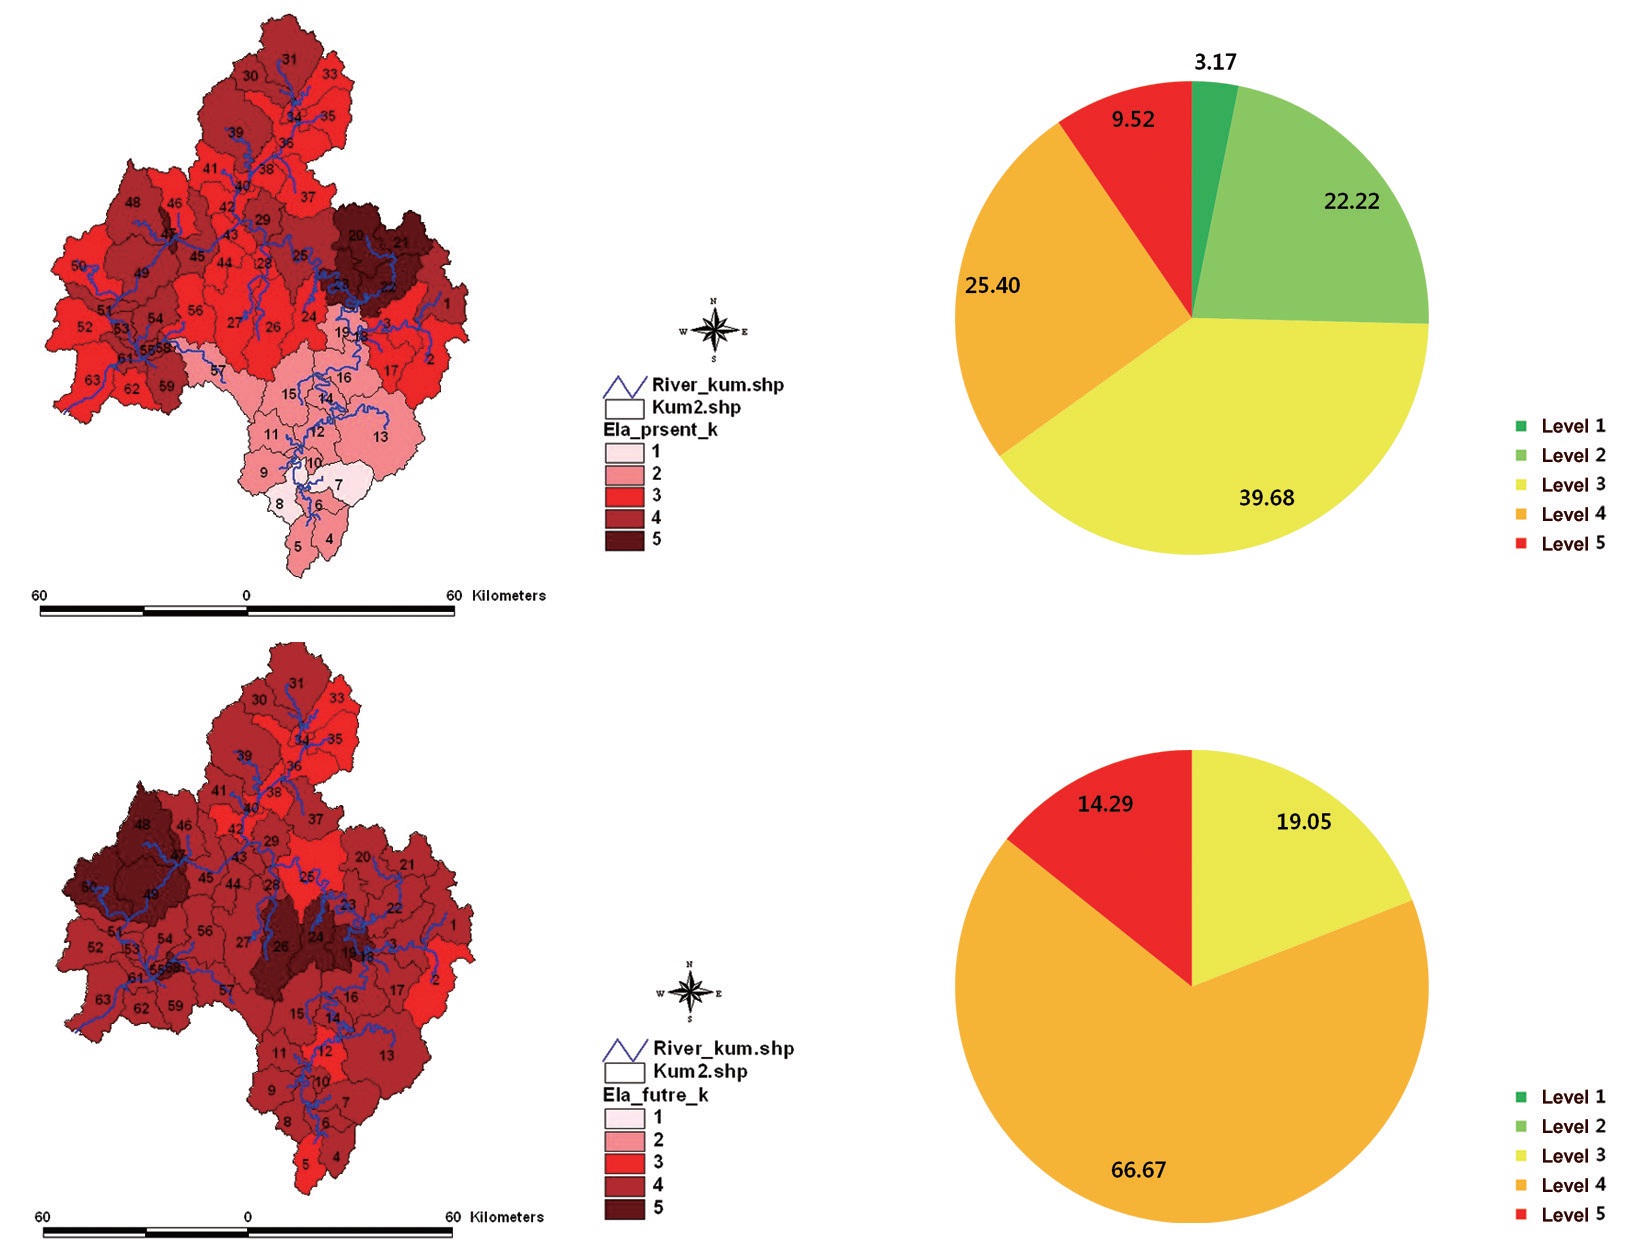
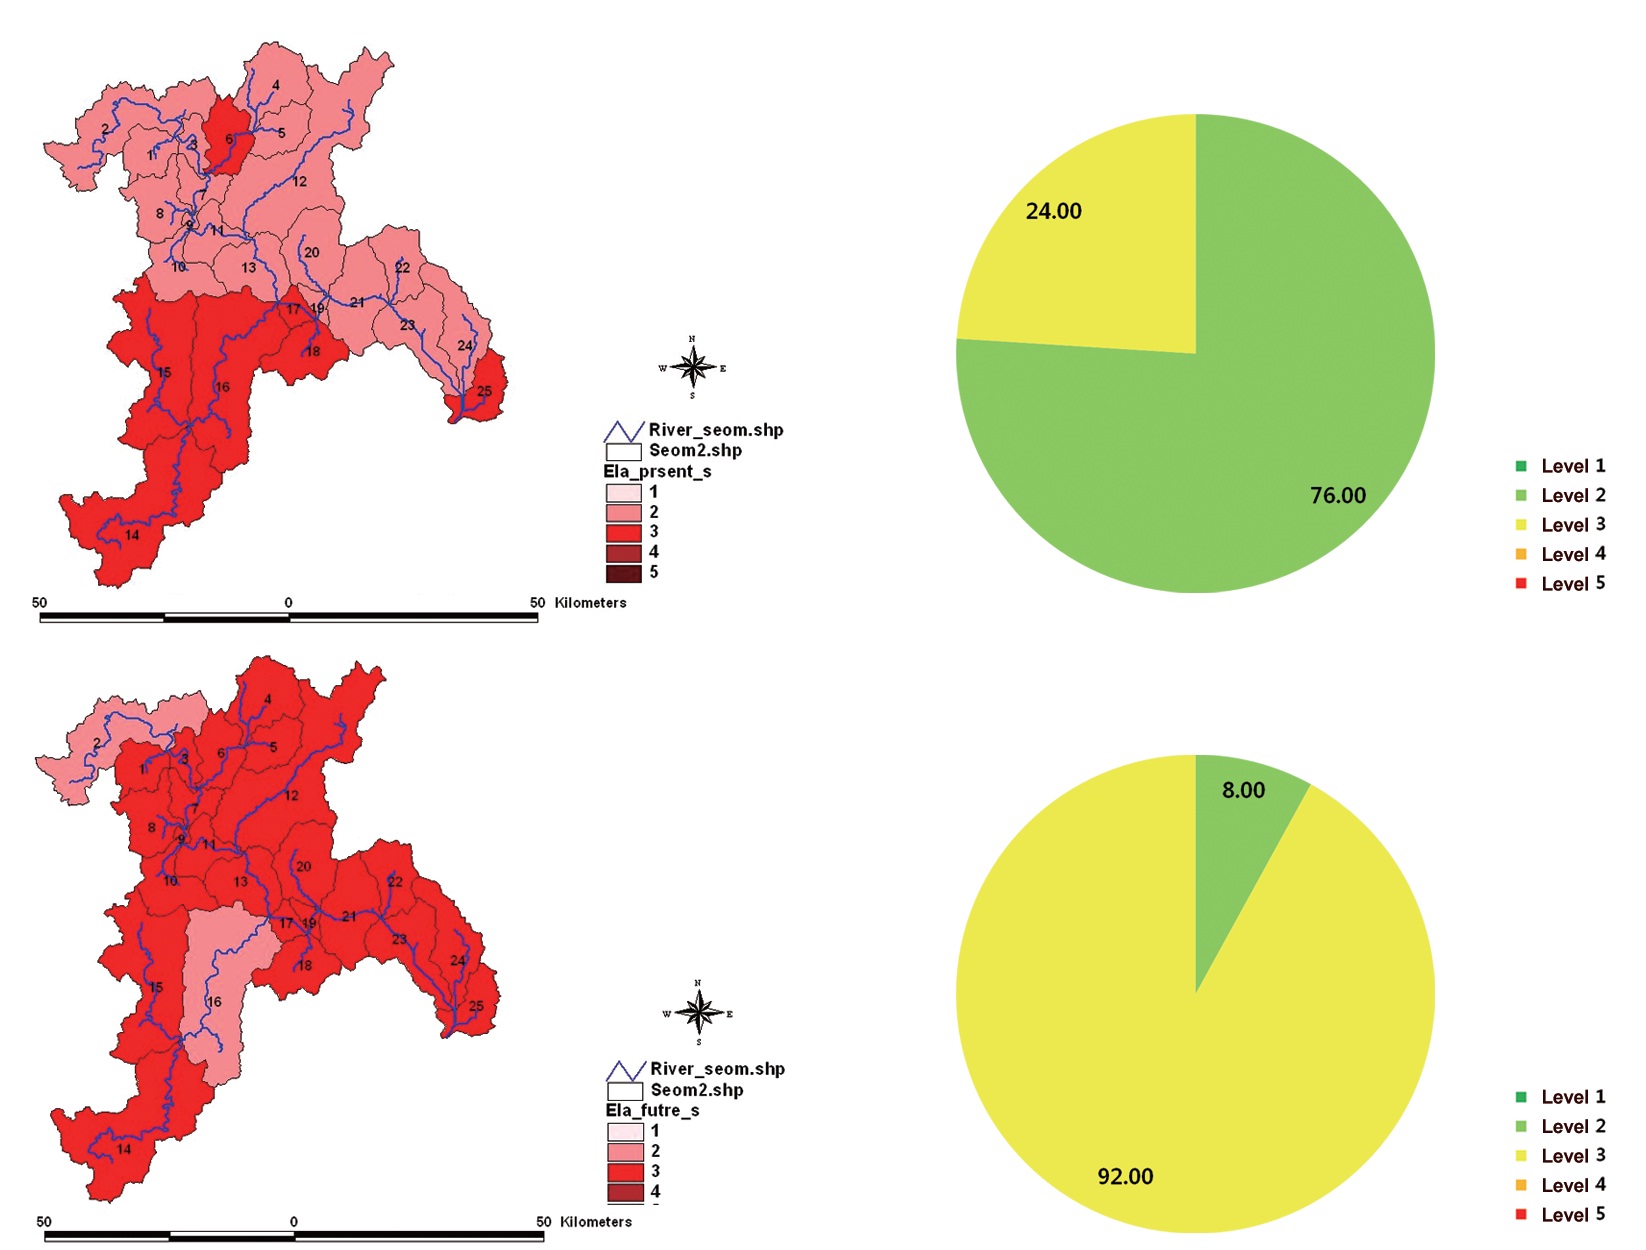
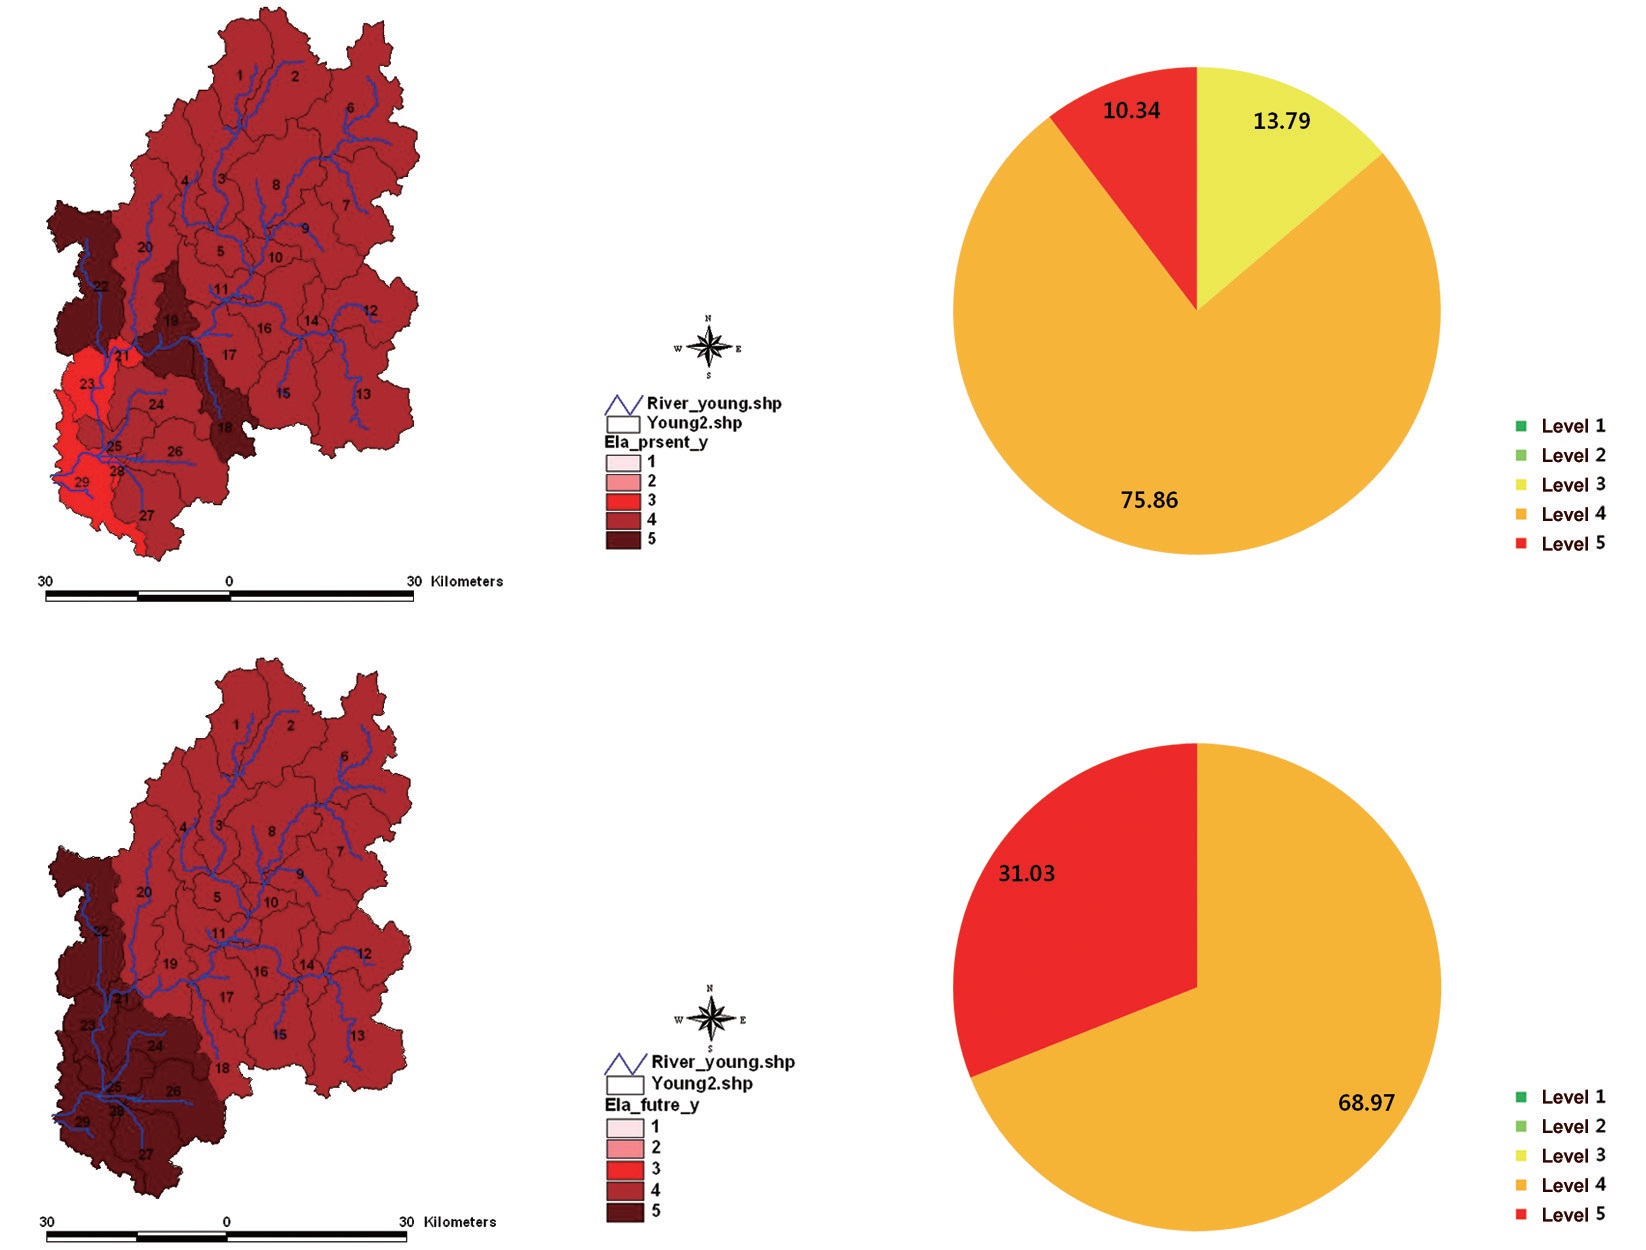
Figs. 14?18 spatially show the grading of elasticity in each zone using the aforementioned kernel density functions. It was confirmed that rainfall elasticity increased on all river basins
other than the Han River. This shows that the sensitivity of water circulation factors on most of the river basins may increase due to climate change and that the balance of the water resource structure may change.
In this paper, a semi-distributed hydrological (SLURP) model was used to simulate the variations of areal rainfall area streamflow, and potential evapotranspiration. A nonparametric method was then used to estimate rainfall elasticity on 5 river basins of Korea. In addition, the A2 climate change scenario and stochastic downscaling technique were used to create a highresolution weather change scenario in river basins, and then the effects of climate change on the rainfall elasticity of each basin were analyzed. The results of this paper are summarized below.
(1) As a result of analyzing the effects of climate change on the variation of annual precipitation, it was simulated as follows: the variation of rainfall in comparison to the present (1973 to 2006) were analyzed. It was simulated that rainfall increased by 7.66% from 2007 to 2030 (2015) compared to the present, 6.11% from 2031 to 2060 (2045), and 7.18% from 2061 to 2090 (2075) on the basin of Han River. In addition, annual mean rainfall tended to increase. However, it was analyzed that the range of rainfall variation increased compared to the present and that 1,000 mm or less of annual rainfall occurred. The analysis results were as follows: on Nakdong River, annual rainfall would increase by 21.14% in 2015, 22.62% in 2045, and 26.20% in 2075. On Geum River, annual rainfall increased by 11.94% in 2015, 4.10% in 2045, and 12.62% in 2075. On Seomjin River, annual rainfall would increase by 10.51% in 2015, 14.86% in 2045, and 25.57% in 2075. On Yeongsan River, annual rainfall would increase by 9.82% in 2015, would decrease by 6.16% in 2045, and would increase by 3.80% in 2075. On Yeongsan River, annual rainfall would decrease in 2045 only.
(2) The results of analyzing the effects of climate change on annual streamflow are as follows: on the basin of Han River, flow rate would increase by 26.23% in 2015 compared to the present (1973?2006), by 10.30% in 2045, and by 8.53% in 2075. On the basin of Nakdong River, flow rate would increase by 5.85% in 2015, 4.66% in 2045, and 11.40% in 2075. On the basin of Geum River, flow rate would increase by 3.56% in 2015, and would decrease by 17.90% in 2045 and 5.63% in 2075. On the basin of Seomjin River, flow rate would increase by 8.96% in 2015, 10.48% in 2045, and 34.02% in 2075. On the basin of Yeongsan River, flow rate would increase by 16.98% in 2015, and would decrease by 26.35% in 2045 and 3.90% in 2075.
(3) As a result of analyzing rainfall elasticity on five river basins, the result showed the range of 0.68 to 2.03. As precipitation or evapotranspiration got higher, the value of both elasticity and streamflow increased, and that of elasticity decreased. In addition, it turned out that area, a geomorphic variable, did not significantly affect elasticity.
(4) It was confirmed that rainfall elasticity increased on all river basins other than Han River. This demonstrates that the sensitivity of water cycle factors may increase due to climate change and that the balance of the water resource structure may change.


![Flowchart of the nonstationary Markov chain model [16, 17].](http://oak.go.kr/repository/journal/12051/E1HGBK_2013_v18n1_9_f002.jpg)