Numerous studies of lentic ecosystems (Kim et al. 2001, Sterner 2011) pointed that lakes and reservoirs are most frequently phosphorus-limited for phytoplankton growth as a concentration of chlorophyll-a (Chl). Thus, strong robust relations of chlorophyll-total phosphorus (TP) were typical in water bodies of North America (Brown et al. 2000, Guildford and Hecky 2000) and Europe (Malve and Qian 2006, Phillips et al. 2008). Some other lakes, however, showed nitrogen-limitation in low-latitude region (Haggard et al. 1999, Rogora et al. 2008). Thus, variations in the relations of nutrient-chlorophyll are depending on the season, region, or nutrient regime, and have been linked to TN:TP ratios, seasonal climatic patterns, morphometry and/or thermal stratification patterns (An 2000, An and Park 2003). However, observational and experimental data of nutrients and algal growth seems to indicate that most lakes are co-limited by N and P as well as, perhaps, by other resources of micronutrients. In spite of these facts, still little is known about the relations of nutrients and algal growth for regional or lake-specific studies of eutrophication processes.
Ratio of mass TN:TP is a good measure for an evaluating the relative availability of these two elements over ecologically meaningful spatial and temporal scales (Smith 1982). In general, concentrations of N and P in lakes and reservoirs are positively correlated, but their ratios vary consistently with lake trophic status such that oligotrophic lakes typically have higher TN:TP ratios than eutrophic lakes (Downing and McCauley 1992). Studies of TN:TP stoichiometry in lake waters, suggest that many if not most lakes should be limited by one or the other element, with a clear shift from P to N limitation as lakes become more productive, and most if not all lakes with TP< 10 μg L-1 should be P-limited, whereas most if not all lakes with TP > 1 mg L-1 should be N-limited. In between the ranges, lakes or reservoirs can vary in N
Such relations, however, can be modified by the Asian monsoon (An and Park 2002, An and Park 2003), which occurs in short period of July – August. An (2000) pointed out that the monsoon resulted in short water retention time in Korean reservoirs and has a dominant influence on seasonal nutrient and light availability. Thus, the monsoon is a key determinant regulating the ambient nutrients and ionic contents of chlorophyll-nutrients (An and Park 2003) along with longitudinal gradients of nutrient regime.
Advances in the interpretation of processes that affect chlorophyll and nutrient concentration will provide a good understanding for management of eutrophication processes. Typical example are shown in trophic state index (TSI) and its two-dimensional graphical approaches (Carlson and Havens 2005), which have been frequently used for a diagnosis of lake trophic status and its limiting factors (Carlson 1977, Xu et al. 2011). Additionally, the deviation between values of TSI by subtracting the TSI (TP), TSI (TN) or TSI (SD) from TSI (Chl) can be used to assess the type and the degree of nutrient limitation and to adjust our predictive models and management decisions accordingly (Carlson and Havens 2005, Pavlidou et al. 2014).
This study was focused in exploring how nutrients (N or P) and solid dynamics vary among the season and location, and these factors influence the Chl and transparency during 1992 – 2013. Also, effects of non-algal light attenuation on TP and Chl were analyzed along with trophic state index (TSI) and its two dimensional TSI-deviations in this system. Special emphasis was given to find the relations of TN and TP on chlorophyll, and its potential roles as limiting factor with non-algal light attenuation were also demonstrated using approaches of trophic state indices and their deviations.
>
Reservoir Watershed and the Study Sites
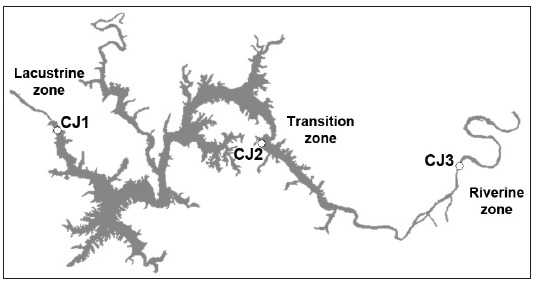
Chungju Reservoir is located in the upstream of southern Han-River, and is known the waterbody of the biggest watershed and the second largest storage capacity of 2.75 billion m3 in Korea. The southern Han-River is located in the upper-middle of Korea, rises in Geomryongso of Gangwon-do, and forms a basin with an area of 23,800 km2. This reservoir is typical multi-purpose waterbody with a basin area of about 6,650 km2 and a 2.75 billion m3 storage capacity, controls the floods, and supplies 3.38 million m3 of the total for diverse purposes on an annual basis (Choi et al. 2010). In this reservoir, three sampling sites were designated to cover the longitudinal gradients of the reservoir depth. The longitudinal zones in the reservoir were divided into three categories of riverine (Rz), transition (Tz), and lacustrine zones (Lz), as shown in Fig. 1. Seasonal variations were also considered in the analysis.
>
Chemical Parameters and Data Analysis
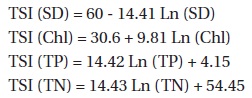
Nutrient data of total nitrogen (TN), and total phosphorus (TP) in Chungju Reservoir were analyzed along with total suspended solids (TSS) and chlorophyll-a (Chl). Total phosphorus (TP) was determined using the ascorbic acid method after persulfate oxidation (Prepas and Rigler 1982), and total suspended solids (TSS) were filtered by GF/C filers and measured by American Public Health Association (1999). Chlorophyll-a concentration was measured by using a spectrophotometer after extraction in hot ethanol (Sartory and Grobbelaar 1984). Secchi transparency (i.e., Secchi depth) was estimated from the empirical equation of total suspended solids [ Log10 (SD) = 0.76 ‒ Log10 (TSS)]. Using the chemical data, seasonal patterns were evaluated by classifying the months as premonsoon (January - June), monsoon (July - August), and postmonsoon (September - December). Annual, monthly, and seasonal mean data were log-transformed in order to follow the regression analysis requirements. Statistical analyses were performed using SigmaPlot (Systat Software Inc.). The calculations of Trophic State Index (TSI) were followed by the approach of Carlson (1977), and the values of trophic parameters were calculated in the three zones and seasons using the three equations as follows;

The criteria of trophic state index (TSI) was followed by the approach of Carlson (1977); values of TSI less than 40 were grouped into oligotrophic state, and the values of 40 - 50 and 50 - 70 were categorized as mesotrophic and eutrophic state, respectively. Values higher than 70 are considered as hypertrophic state (Carlson 1977). Non-algal light attenuation coefficient (

>
Precipitation Pattern and Flow Regime
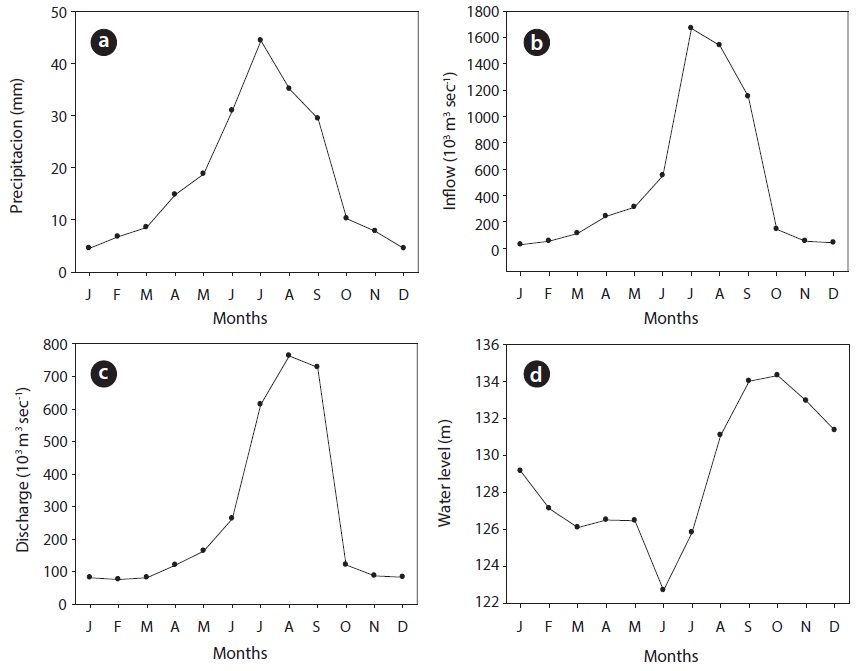
Long-term precipitation and flow regime during 1992 – 2013 were determined by the Asian monsoon (Fig. 2). Highest precipitation occurred during summer monsoon season of July and August with a mean value of 44.5 mm and 35.2 mm respectively (Fig. 2a). The two month rainfall events were 36.9% of the total annual precipitation, indicating a massive rainfall in the monsoon. Lowest precipitations were observed in winter season of December and January with mean values 4.513 mm and 4.51 mm, respectively (Fig. 2a). The precipitation directly determined the flow regime of inflow and discharge in the reservoir: monthly inflow ranged from 25.92 × 10³ m3/sec in January to 1668.8 × 103 m3/sec in July (Fig. 2b), while total outflow or discharge from the dam ranged from 75.4 × 10³ m3/sec in February and 81.2 × 10³ m3/sec in January (Fig. 2c). In the meantime, monthly lake stage showed a typical pattern with a highest level in the postmonsoon of October with 134.3 m, and the lowest level in June with 122.7m (Fig. 2d). These results indicate that the flow regime of the reservoir is directly regulated by the seasonal monsoon. However, inter-annual variabilities in the flow parameters were uneven due to the differences of the annual intensity of the Asian monsoon.
>
Nutrients and Chlorophyll Dynamics with Suspended Solids
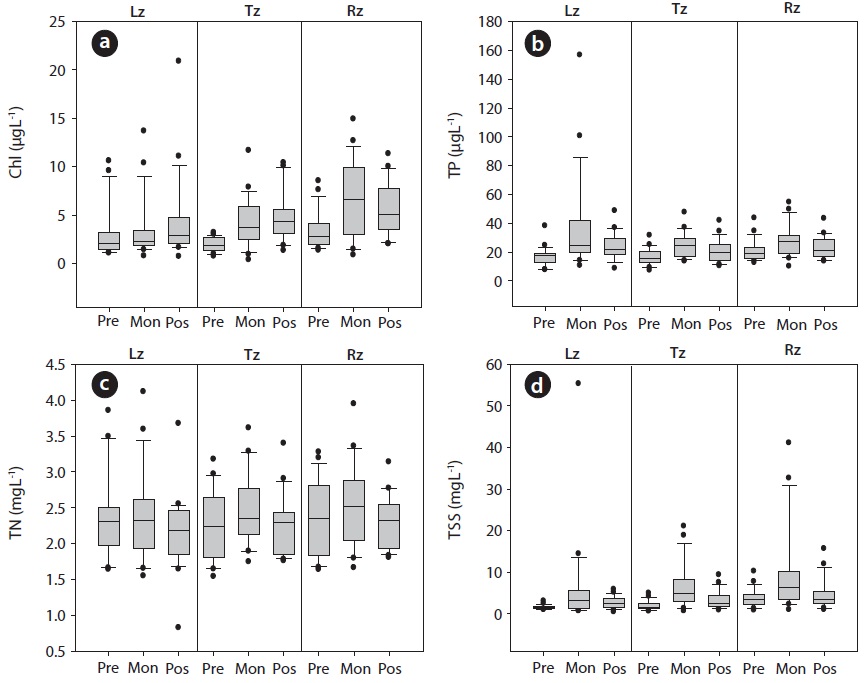
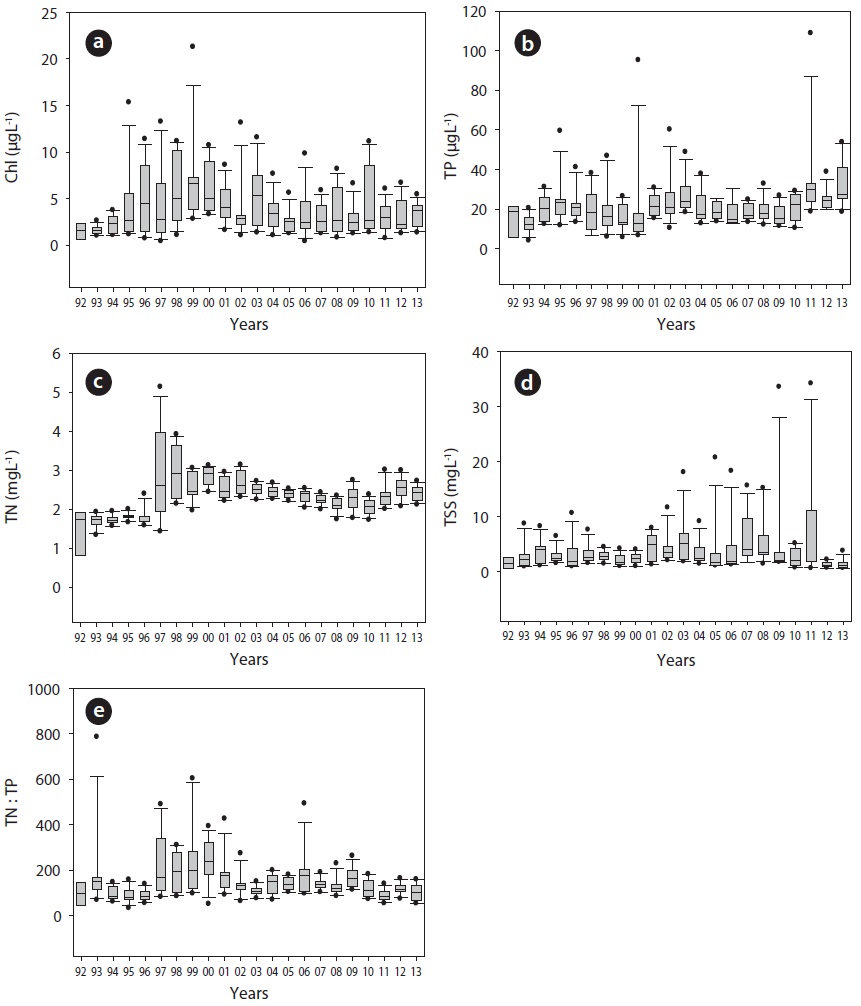
Chungju Reservoir showed distinct spatial and temporal heterogeneities in the distribution of nutrients and chlorophyll-a (Fig. 3). The spatial patterns were depicted as three longitudinal gradients of riverine (Rz), transition (Tz), and lacustrine zone (Lz) from the headwaters to the dam, and the zonal differences in nutrients and Chl were relatively low. Mean values of TP in the lacustrine zone averaged 22.4 μgL-1 having a peak in 2011 (56.1 μgL-1); in the transition zone, 19.8 μgL-1 with a maximum value in 2013 (37.6 μgL-1) and the riverine zone averaged the same value like lacustrine zone, 22.4 μgL-1 with the highest value also in 2013 (41.3 μgL-1). Values of TN did not show an important variation, in that TN values averaged 2.3 mgL-1 having a peak at1998 (3.4 mgL-1) in the lacustrine zone, 2.3 mgL-1 with a maximum value at 1997 (2.8 mgL-1) in the transition zone, and 2.4 mgL-1 with the highest value at 2000 (3.2 mgL-1) in the riverine zone. At the spatial scale, values of Chl averaged 3.6 μgL-1 having a peak at 1998 (13.1μgL-1) in the lacustrine zone, 3.3 μgL-1 with a maximum value at 1996 (5.3 μgL-1) in the transition zone, and 4.7 μgL-1 with the highest value at 2000 (9.3 μgL-1; Fig. 3) in the riverine zone. Previous limnological studies of reservoirs (Kim et al. 2001, Lee et al. 2014) showed that the longitudinal gradients of nutrients, algal biomass, and solid contents were large, and that the gradients were most pronounced in the high flow periods. Such longitudinal gradient of Rz-Tz-Lz was evident in North American (Kennedy and Walker 1990, Vanni et al. 2006) and Asian reservoirs (Liu et al. 2013, Kwon and An 2014), but was not observed in Chungju Reservoir. Values of TSS averaged 2.8 mgL-1 having a peak at 2009 (10.9 mgL-1) in the lacustrine zone, 3.2 mgL-1 with a maximum value at 2011 (6.2 mgL-1) in the transition zone, and 5.1 mgL-1 with the highest value at 2011 (12.5 mgL-1) in the riverine zone. These results indicate that longitudinal gradients in the concentrations of chemical parameters are not high along the main axis of Rz-Tz-Lz in this reservoir.
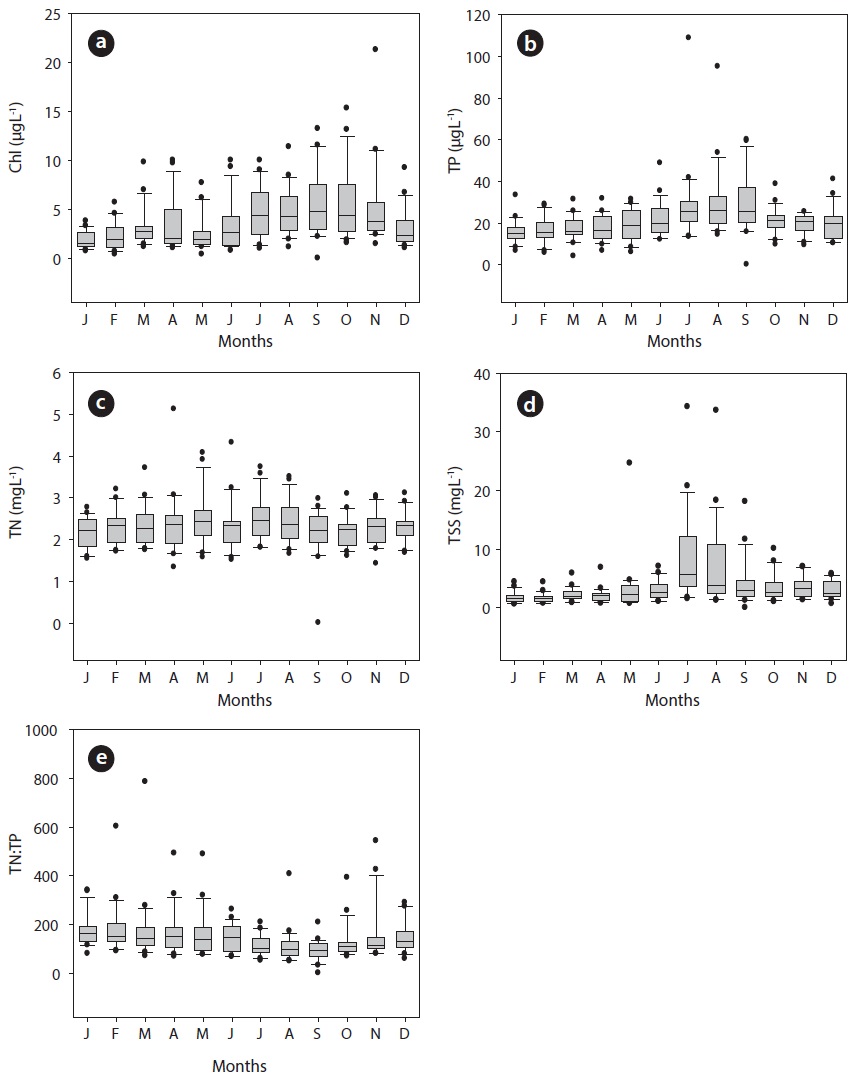
In the meantime, seasonality of nutrients and chlorophylls had high fluctuations by the flow-dominated monsoon (Fig. 4). Values of Chl increased during the postmonsoon, especially in September (14.5 μgL-1) and October (15.8 μgL-1). In contrast, monthly means of Chl decreased in the winter season of January (1.8 μgL-1) and February (2.1 μgL-1). Concentrations of TP showed a stable pattern with low values of < 20 μgL-1 from January to June, but increased suddenly in the monsoon period of July to August. In fact, the difference of TP between the premonsoon and monsoon was statistically significant (

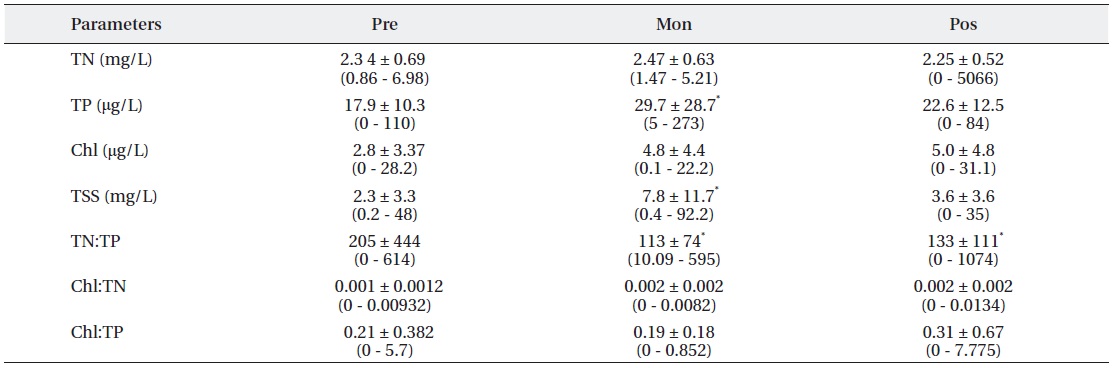
Seasonal patterns of nutrients for total nitrogen (TN) and total phosphorus (TP), chlorophyll-a (Chl), total suspended solids (TSS), and their nutrient ratios (TN:TP, Chl:TN, and Chl:TP) during the premonsoon (Pre), monsoon (Mon), and postmonsoon seasons (Pos) of 1992 - 2013. The data in the table (n = 22) were expressed as “mean ± SD” and their ranges (minimum? maximum) in brackets
Long-term fluctuations of annual Chl, TP, TN, TN:TP, and TSS are shown in Fig. 5. Maximum values of Chl occurred in 1996 (9.03 μgL-1), excluding outliers observed in the lacustrine zone during the postmonsoon of 1998 (20.9 μgL-1), and the minimum of 1.2 μgL-1 during the postmonsoon of 1992. Annual mean of TP reached maximum (56.8 μgL-1) in 2000 and minimum (9.7 μgL-1) in premonsoon of 1993. Values of TN peaked in 1998 (3.58 mgL-1), and the lowest TN was observed during the postmonsoon of 1992 (1.3 mgL-1). TSS averaged 24.4 mgL-1 and 0.85 mgL-1 during the postmonsoon season of 2009 and 1992, respectively (Fig. 5).
>
Mann-Kendall Tests for Annual Trend Analysis
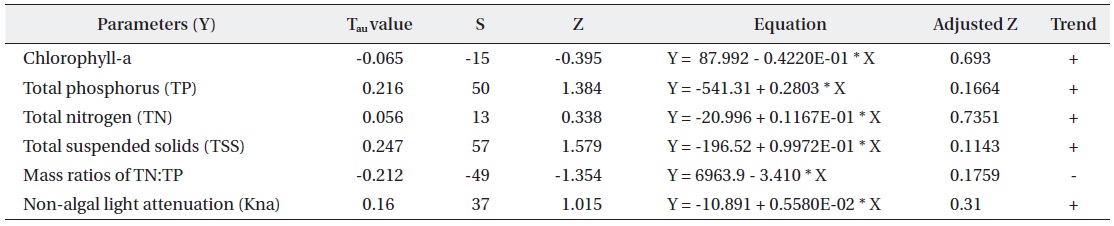
In this study, annual trends of chemical parameters such as chlorophyll (Chl), TP, TN, and TSS were analyzed using the approach of Mann-Kendall tests, as shown in Table 2. The trend test is one of the widely used non-parametric tests to detect significant trends in time series, especially long-term annual trends. It combines the individual results into one overall test for whether the dependent (Y) variable changes in a consistent direction (monotonic trend) over time. Menn-Kendall tests (Table 2) showed that chlorophyll-a, as a measure of primary productivity, showed an increasing trend (Tau = -0.065, Z = -0.395), while nutrients of TN and TP also showed increasing trends (Tau = 0.216, Z = 1.384 in TP; Tau = 0.056, Z = 0.338 in TN; Table 2). Similarly, TSS showed an increasing trend (Tau = 0.247, Z = 1.579) with other variables over the year along with non-algal light attenuation (Kna ; Table 2). Thus, all chemical parameters showed the increasing trend over the 22 years in Chungju Reservoir. This test indicates that since the reservoir has been eutrophied over the time, the efficient watershed management is required in the reservoir.

Statistical tests of Mann-Kendall for chemical parameters over the long-term years (X) of 1992 ? 2013 in Chungju Reservoir
>
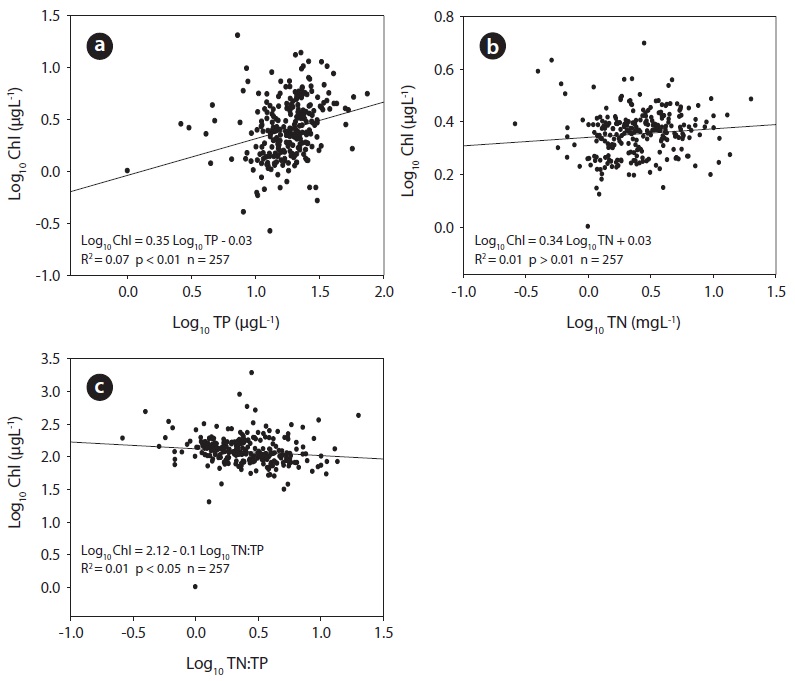
Empirical Regression Models of Chl - Nutrients
During 1992- 2013, ratios of TN:TP averaged 165.8 and varied from 87.3 in 2011 to 443 in 1997, indicating that this system is potential phosphorus-limitation, when we just see the nutrient ratios and absolute values of nitrogen and phosphorus in the reservoir. This was demonstrated by previous lake and reservoir researches of Asian (Liu et al. 2013, Kwon and An 2014) and North American waterbodies (Brown et al. 2000, Guildford and Hecky 2000). The P-limitations, however, are frequently modified by turbid inflow, so phosphorus limitation may not be true due to low underwater light availability, high inorganic suspended solids, and high flushing rate by short water residence time. Ratios of chlorophyll: total phosphorus (Chl:TP) averaged 0.24 and ranged from 0.1 in 1992 to 0.7 in 1999. Previous studies pointed out that low values of Chl:TP (0.24 μgL-1) were closely associated with turbid, nutrient-rich inflows in reservoir ecosystem across the entire trophic range. The ratios of Chl:TN averaged 0.002 and ranged from 0.0009 in 1993 to 0.003 in 1996. In our reservoir, regression analysis of TN and TP on the chlorophyll supported the potential modifying factors of low underwater light availability, high inorganic suspended solids (nonvolatile suspended solids), and the high flushing rate. Empirical models (Chl-TP, Chl-TN, and Chl-TN:TP) showed weak relations (Fig. 6); values of R2 were < 0.08 in the Chl-TP and Chl-TN models, even though p-values were significant in the Chl-TP model.
>
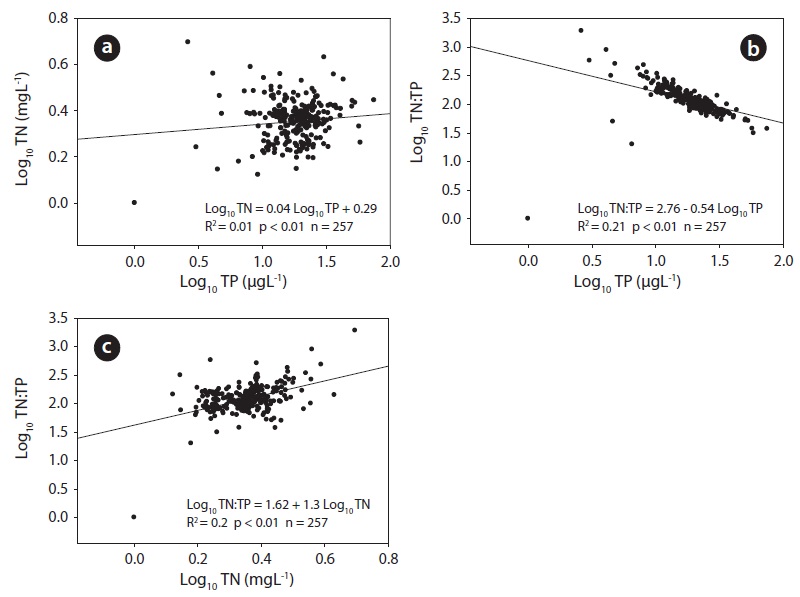
Relations of N:P Ratios to Nnutrients (N or P)
The relation between log-transformed TN and TP concentrations was very weak (R2 = 0.01), even though the relation was statistically significant (
>
Non-algal Light Attenuation (Kna)
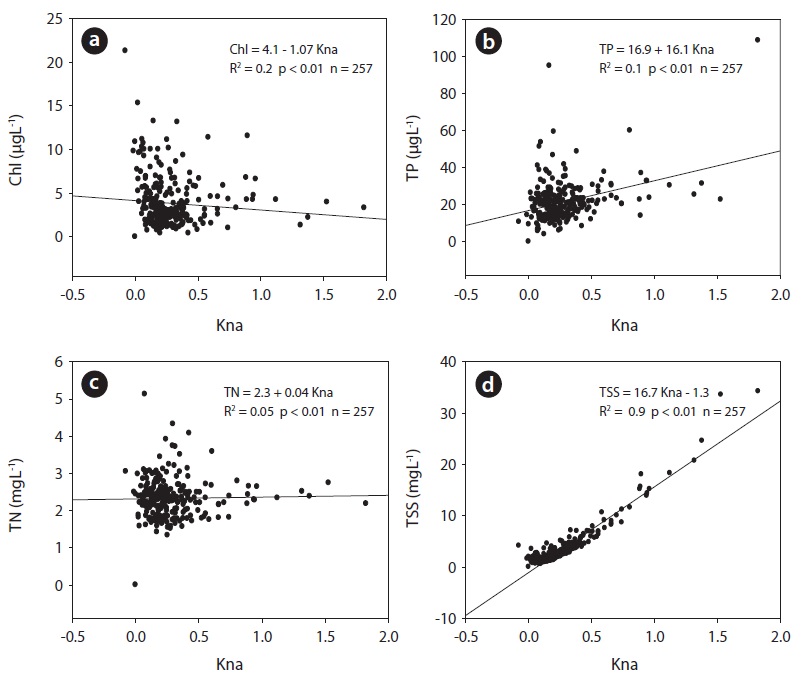
In this study, we estimated non-algal light attenuation coefficient (Kna), which is closely associated with underwater light availability. The coefficient is generally controlled by four major factors that reduce light penetration in the water column: the water itself (a function of depth), algal biomass, non-algal particulate material (i.e., volatile suspended sediment), and colored dissolved organic matter (Ganju et al. 2014). In Chungju Reservoir, chlorophyll had a low correlation with Kna, probably due to high turbid-water flushing and inorganic solid dominance during the monsoon, which would act as lightlimiting factors (Fig. 8a) and increase the chlorophyll
>
Analysis of Trophic State Index Deviation (TSIDeviation)
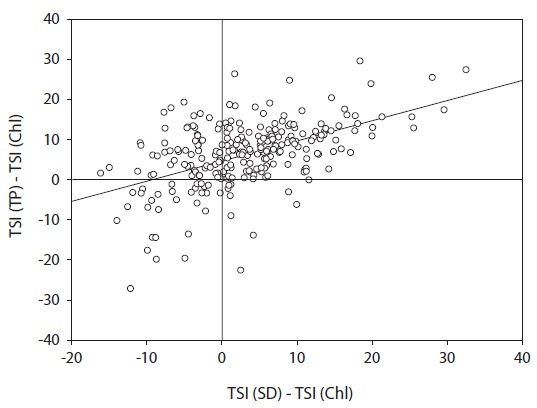
In Chungju Reservoir, deviations from Carlson’s Trophic State Index (TSI; Carlson, 1991) was evident; about 65% of the total observation was dominance of inorganic solids or clay particle in the relations of between [TSI (SD) – TSI (Chl)] and [TSI (TP) – TSI (Chl)] (Fig. 9). Thus, the relations of Trophic State Index (TSI) indicated that phosphorus limitation was weak [TSI (Chl) – TSI (TP) < 0; TSI (SD) – TSI (Chl) > 0] and the effects of zooplankton grazing was also minor [TSI (Chl) – TSI (TP) > 0; TSI (SD) – TSI (Chl) > 0] (Fig. 9). Our result is somewhat different from the previous studies of this reservoir that phosphorus limitation was evident. We believe that this difference may be come from the averaging effects. Our data used here was based on monthly data rather than the annual or site mean values. Therefore, further studies on the trophic state index deviation are required along with the analysis of non-volatile suspended solids. According to our results, phytoplankton growth in Chungju Reservoir may be partially influenced by potential non-algal light attenuation and dominance of particulate nutrients (i.e., particulate phosphorus), especially during flow-dominated monsoon season. So still there is a potential phosphorus limitation during non-monsoon seasons (spring, fall, and winter). This hypothesis also should be tested using the mesocosm experiments during the flood season.